This post was originally published in 2016. The key formula used in the dividend spreadsheet template for dividend info from Google Finance was formulated back in 2014.
Due to the changes in Google Finance in March 2018, it was necessary to update the formula for pulling the dividend data. As you may know, pulling dividend data directly Google Finance no longer works.
After looking on the web, I found that Yahoo Finance is a good reliable alternate source to pull the dividend data from.
Jul 2020 Update: The ImportXML is having regular issues pulling data from Yahoo Finance due to Javascript. So this made the dividend spreadsheet template a bit unreliable.
Many users have reached out to me regarding this issue. After some research, rather than relying on the ImportXML function, I decided to update the dividend spreadsheet template with a different and more reliable function that’d do the exact same thing.
Dec 2020 Update: The ImportFromWeb add-on has a monthly pull limit. So if you check your portfolio regularly, by middle of the month, you won’t be able to see any dividend yield data. After experimenting a little bit, I decided to ditch ImportFromWeb and use another function called ImportHTML. ImportHTML is very similar to ImportXML but seems to be a bit more reliable.
Jun 2023 Update: Recently .UN tickers stopped working with Google Finance. I’ve found ways to workaround this. Scroll below to find out how.
A while ago I shared my tutorial how to use Google Spreadsheet for dividend portfolio. In the tutorial, I resolved the key problem of the build-in GOOGLEFINANCE function – its inability to pull stock dividend information, to be more specific, dividend per share and dividend yield.
Although I shared the formula to pull dividend information automatically using Google Spreadsheet in the tutorial, many readers asked about sharing a dividend portfolio spreadsheet template that utilizes Google Spreadsheet to track their dividend portfolio and dividend income.
As you can see, this post is a bit long overdue (sorry!). After many months of revising my own Google spreadsheet dividend portfolio template, I thought it might be a good idea to write a “step by step guide” on how I created a Google finance dividend spreadsheet portfolio for tracking my own dividend portfolio and dividend income.
At the end of this post, I also shared a link for downloading the dividend Google spreadsheet template for free.
I’m a self-proclaimed Excel nerd. I love Google Spreadsheet because I can access the spreadsheet anywhere in the world, as long as there’s internet access (you can also enable offline mode so you can access the dividend spreadsheet without an internet connection). I really hope this step by step guide will help many of you.
Please note, since I am sharing the dividend investing template aka dividend tracker I use to track our dividend portfolio, the design is based on owning both US and Canadian listed dividend stocks. If you invest in a different currency, you should be able to easily modify the currency information.
Learning about dividend investing
If you’re reading this step-by-step guide. You are probably interested in dividend growth investing. Some here are great articles I have written in the past that you may find useful.
The first step when it comes to dividend growth investing and building your dividend portfolio is to determine how to start investing in dividend-paying stocks.
Eliminating stocks by looking at the different financial numbers is important but it is just as important to learn how to read the annual and quarterly reports. For Canadian dividend investors, you must understand how to build your portfolio so it can be as tax efficient as possible.
For further reading, please take a look at the following two FAQ’s I have put together:
- Dividend Investing FAQ (Mostly for Canadians but works for other countries too).
- Dividend & Index Investing FAQ.
Google finance dividend portfolio template and dividend tracker
Ok, let’s get back onto topic. Here is the step-by-step guide on how I created the Google dividend tracking spreadsheet.
Step 1: Create a Google Account
Most people have a Google account but if you don’t, create one so you can use Google Drive. Once you have an account, access your Google Drive and create a new Google Spreadsheet.
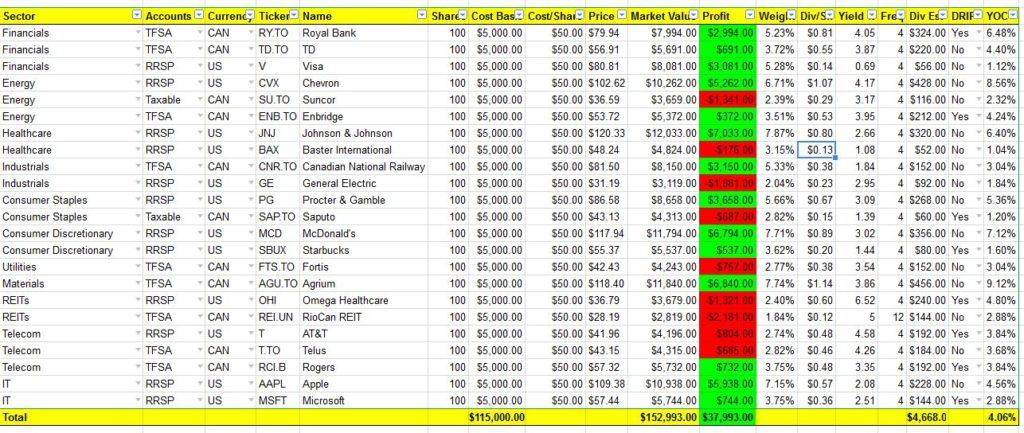
Step 2: Create headings for the Dividend Portfolio Template
The first sheet I rename it to Dividend Portfolio. I also create headings that I want to use to track my portfolio. After many changes, I decided to use the following headings:
- Sector: The sector the stock belongs to
- Accounts: Which accounts we hold the stock in
- Currency: Since we hold US and CAN listed stocks, this allows us to calculate the portfolio market value in Canadian currency
- Ticker: Stock ticker symbol
- Name: Name of the stock
- Shares: Number of shares we own
- Cost Basis: How much we paid to purchase the stock
- Cost/Share: Price per share that we paid for the stock
- Price: Current market price
- Market value: Current market value of the stock
- Profit: How much unrealized profit we are making
- Weight: Stock weight of the portfolio as a percentage
- Div/Sh: Div per share received per dividend payout
- Yield %: The current dividend yield of the stock
- Freq: How many times the stock pays dividend in a year (Update: This field is no longer needed in the new version of the template)
- Div Est: Estimated dividend payout for the year
- DRIP: Whether we are DRIPing the stock or not
- YOC: Yield on cost
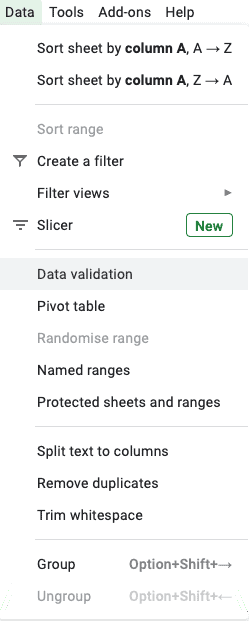
Step 3: Populate drop-down list
For headlines like Sector, Accounts, Currency, Ticker, and DRIP, I populated drop-down lists. To do so, select the desired rows then go to Data -> Validation. Under Criteria, select a List of items, then enter the desired items separated by columns.
I like the drop-down list as it saves quite a bit of time when entering data.
Step 4: Enter data
Enter the respective data in each row. Data like sector, accounts, currency, ticker, name, shares, cost basis, and DRIP should be pretty easy to enter.
The rest of the fields are calculated automatically based on a straight forward formula.
For Cost/Share, the formula that I used was for Cost Basis / Shares. For example, for Royal Bank, I entered “G3/F3.”
The two columns that required some data pulling are the Div/Sh and Yield columns. For those, I used the ImportXML function which I described in my original Google Spreadsheet tutorial.
For formula requires specifying XPath from Yahoo Finance. For some reason, I wasn’t able to incorporate it into the actual formula. So in the spreadsheet template, I am referencing a cell.
Also a key thing to note is that stocks with a “.” in their symbol are labelled differently for Google Finance and Yahoo Finance.
For example, Rogers would be RCI.B on Google Finance, but it would be RCI-B.TO on Yahoo Finance. Since we utilize GOOGLEFINANCE in the Price Column, and use Yahoo Finance to pull the dividend data, you will need to manually tweak the ImportXML formula slightly. Again, please refer to my original Google Spreadsheet tutorial for more information.
July 2020 Update: ImportXML has been consistently outputting N/A. This is caused by Yahoo Finance using a lot of Javascript so ImportXML cannot pull the dividend info reliably.
As a dividend investor, not having the dividend info in the dividend spreadsheet is not ideal. So I looked around to find an alternative.
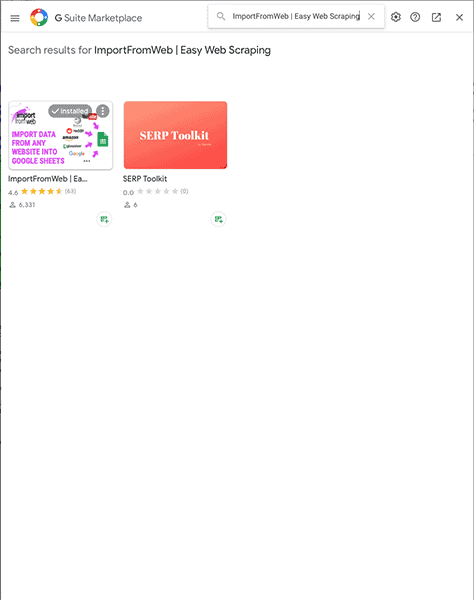
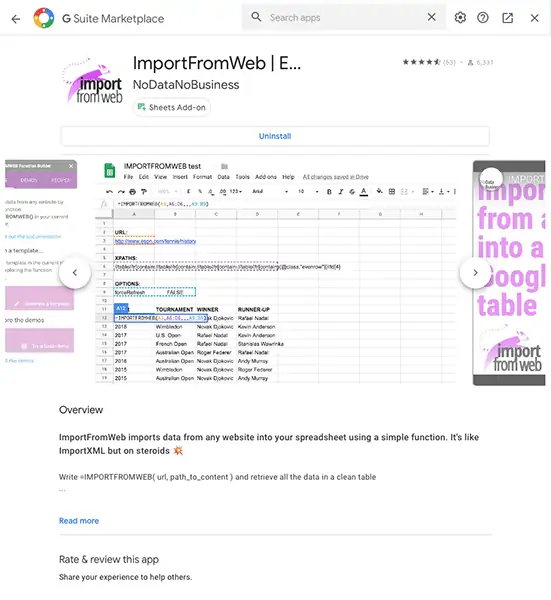
Fortunately, I found an alternative called ImportFromWeb. I have updated the spreadsheet and used an add-on function that’d do the same job. The add-on function is called “ImportFromWeb.” In order to use ImportFromWeb you need to do the following:
- Click on Add-ons and search for “ImportFromWeb”
- Install “ImportFromWeb” Add On
- Once it’s installed, you can replace “ImportXML” to “ImportFromWeb” in the formula
- Div & yields info should show up without any issues

For example:
ImportXML Formula: =split(IMPORTXML(concatenate(“https://finance.yahoo.com/quote/”,D5),$B$47),”()”)
ImportFromWeb Formula: =split(ImportFromWeb(concatenate(“https://finance.yahoo.com/quote/”,D5),$B$47),”()”)
Basically the formula is identical, we are just interchanging ImportXML and ImportFromWeb. You would continue to get the same dividend info in the Google dividend spreadsheet.
Note: ImportFromWeb will ask you for some access permission for your Google Account. If you’re not comfortable with this, do not use this add-on.
Dec 2020 Update: I received a lot of complains about using ImportFromWeb. First of all, some readers forgot to enable the add-on, rendering the spreadsheet somewhat useless. Then some readers found that they’d constantly use up the ImportFromWeb’s monthly limit, again, rendering the spreadsheet somewhat useless.
I started looking at an alternative way to pull dividend data into the spreadsheet and found that ImportHTML works pretty well.
So the spreadsheet has been updated to use ImportHTML.
ImportHTML Formula: =SPLIT(INDEX(IMPORTHTML(concatenate(“https://finance.yahoo.com/quote/”,D5),”table”,2),6,2),” “)
As you can see, it’s very similar to the old formula, expect pointing to an Xpath, I know pointing to the location of the table directly.
For those of you that are coders, you’ll notice that I’m still referencing the exact place in the code but using the HTML format rather than the Xpath format.
Jun 2023 Update: Recently, .UN tickers (FTS.TO too) stopped working with Google Finance. You can try using the following formula to pull price instead:
=INDEX(importhtml(https://www.morningstar.com/stocks/xtse/rei.un/quote”,”table”,1),2,2)
Change “rei.un” to the desired ticker Alternatively, you can also use this formula
Or this formula below:
=INDEX(importhtml(https://ycharts.com/companies/DIR.UN.TO/price,”table”,1),2,5)
Step 5: Data conditional formatting
To make it easy to see whether you’re making a profit on a particular stock, I used conditional formatting to colour the Profit column red or green based on whether there’s any profit or not.
To do this, simply select data under Profit column, then go Format -> Conditional Formatting. A conditional format rules window will pop up on the right-hand side of the sheet.
The rule to use is “Format cells if Greater than or equal to 0.” Then I labelled the formatting style to use green. Next, I created another conditional format rule calling out “Format cells if less than 0” and labelled the formatting style to use red.
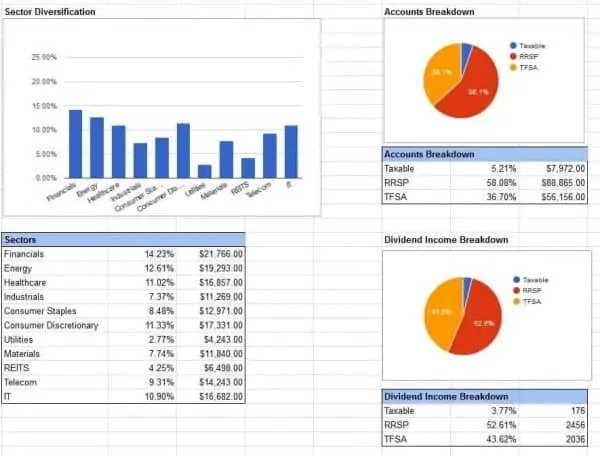
Step 6: Creating charts for the Dividend Portfolio Template
For this Google Spreadsheet dividend portfolio template, I created 3 charts to track Sector Diversification, Accounts Breakdown, and Dividend Income Breakdown. I like charts because they give good visual summaries.
To create these 3 charts, first I had to create three separate tables with the appropriate data. To get the data needed, I used a simple function called SUMIFS. Basically the function adds up a range depending on the criteria.
For example, to add up the market value of all dividend stocks in financial sectors I used the formula “SUMIFS(data in market value column, data in sector column, Financials).” (Actual formula: SUMIFS($J$3:$J$25,$A$3:$A$25,T19)
Next, I calculated the percentage of each headline.
Once I had the tables completed, I selected the data range I wanted to use, clicked on the Insert Chart button and inserted the desire chart type.

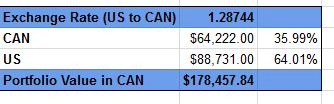
Step 7: Currency Exchange
Because our dividend portfolio has a mix of Canadian and US-listed stocks, I decided to show a breakdown and the market portfolio value in the Canadian dollar.
To query the current exchange rate, I used the function GoogleFinance(“CURRENCY:USDCAD”).
The SUMIFS function was utilized again to add up the market value of all Canadian and US stocks. With the US to CAN exchange rate available, I converted the US stock value into Canadian currency to show the entire portfolio value in the Canadian dollar. The breakdown percentages are also calculated in the table.
Geographical diversification is even more important than ever.
If you’re a Canadian, the last thing you want to do is investing 100% in Canadian stocks. This is another reason why utilizing an ex-Canada international index ETF like XAW or VXC is a good idea. It is also a good idea to purchase US dividend-paying stocks in your RRSP to avoid withholding taxes.
Step 8: Summary Report
I’m a very visual person so I like to have a summary report to see all the important numbers. Hence, for this Google Spreadsheet dividend portfolio template, I created a table to list all the important values like Book Value, Market Value, Profit, Estimated Annual Dividend, and YOC.
Step 9: Dividend Income
A dividend portfolio template is no good if you don’t have a sheet to track your annual dividend income. Hence I created a new sheet called dividend income to track annual dividend income.
A long time ago I used to only list the stock tickers in the dividend income sheet. But it was confusing for Mrs. T when I got her involved in tracking our household finance. So I added stock names to make it easier. 🙂
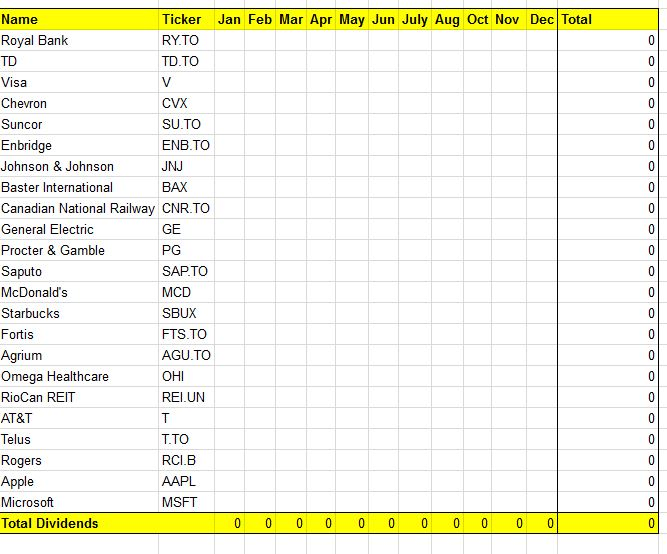
Whenever a stock pays dividends, you can populate the data under the respective month. Once the year is over, you can create another sheet to track the new year’s dividend income.
Possible Improvements for the dividend spreadsheet template
I personally use this dividend spreadsheet myself for tracking our dividend portfolio and found it extremely useful. There are some possible improvements to be made to the spreadsheet to make it even better though.
For example, being able to incorporate some or all of the parameters in the dividend scorecard so one can quickly analyze stocks in the dividend portfolio. In addition, some numbers that may be useful in the spreadsheet are:
- 5 year annualized dividend growth rate
- PE ratio for each stock
- 10 year average dividend yield percentage. This can be a good indicator on whether the stock is over-valued or not.
- Last dividend increase
- Dividend payout schedule
Some of these should be straight forward to implement (just takes time), some may take a bit of time. Once I have a bit more time, I may fine tune and improve the dividend spreadsheet template a bit.
Dec 2020 Update: I updated the spreadsheet and added a column for PE ratio.
Final Words – Dividend Portfolio Template (Dividend Tracker)
If you have read this far, you are probably wondering where’s the actual Google dividend spreadsheet template is.
Here is the free Google Finance Dividend Portfolio Template you can download. I have added a few notes in the document to answer some questions you might have.
Please feel free to play around with this spreadsheet and adjust things to your liking.
This is a long overdue post and I hope some of you will find this Google Finance dividend portfolio template useful. If you have any questions, please either comment below or send me an e-mail.
Even if you don’t have any questions, I would love to hear from you on what you think of the template or if there’s something you’d like me to add to the template.
Now if you are looking for tops 10 Canadian dividend stocks, top 10 Canadian dividend ETFs, top US dividend ETFs, and other ETFs to own. You can check out these pages.
- Best Canadian dividend stocks
- Best Canadian monthly dividend stocks
- Tops Canadian dividend ETFs
- Top US dividend ETFs
- Canadian Dividend Calendar
- Best Canadian utility stocks
- 6 Best Canadian Bank ETFs
- All-in-one ETFs comparision
- All Equity ETFs comparision
And if you’re doing index ETF investing, you might find the ETF Portfolio spreadsheet useful.
Thank you for taking the time to go through this step-by-step dividend spreadsheet template tutorial. If you have any questions, tips, or recommendations, feel free to contact me. I’d love to hear from you.
And please leave a comment on how you’re finding this dividend spreadsheet template!