
Since publishing my analysis of all-in-one ETFs in Canada and mentioning that we are going from multi-ETFs to all-in-one ETFs for our kids’ RESPs, we have gone ahead and made the changes. We picked iShares Core Growth ETF Portfolio (XGRO) which has an 80% equities and 20% bonds mix. However, since our kids are still quite young, it means we won’t be making withdrawals for at least 12 years. Therefore, I began to wonder, is XGRO the right approach? Or should I go with one of the all equity ETFs instead? Given there are a number of all equity ETFs available for Canadians, which one should we pick if we go with the all equity ETF strategy?
Current RESP Strategy
Our current RESP plan is as below. We plan to shift the amount of bonds we hold in the RESP as our kids get older by utilizing the different all-in-one ETFs.
| Index | 0-10 Yrs | 10-15 Yrs | 15-18+ Yrs |
| XGRO | 100% | 70% | 0% |
| XBAL | 0% | 30% | 100% |
With this RESP all-in-one ETF strategy, from 0-10 years, we’d hold around 80% in equities and 20% in bonds. I decided to do a mix of XGRO and XBAL so we’d hold around 26% in bonds when the kids are between 10 and 15 years old. Then when they are older than 15, we’d hold XBAL only and have about 40% exposure to bonds. This age tiered approach should help stabilize the portfolio value by reducing exposures to market volatility.
But does holding this much bonds make sense given today’s super low interest rate environment? I started to question this strategy a few weeks after we made the change.
Does holding all equities in RESP make sense?
With young kids and a withdrawal timeline of more than a decade, wouldn’t it make sense to hold 100% stocks in their RESPs? Or does it make more sense to hold some bonds in RESPs since a decade is relatively “short” when it comes to investment timelines?
Ed Rempel, a Canadian financial blogger, fee-for-service financial planner and tax accountant, recently examined how to easily outperform investment advisor & robo-advisor. In the article, he mentioned that it makes sense to have a portfolio consisting of all equities, as stocks outperform bonds and cash over the long term.
Per Ed…”The worst 25-year calendar return of the S&P 500 in the last 90 years is a strong 7.9% per year. Bonds made zero after inflation for 80 years from 1900-1982. Bonds lost nearly 50% after inflation for 40 years from 1940-1980.”
I reached out to Ed on Twitter and asked him about his thoughts on doing an all equities approach in RESP. This is what Ed replied with:
RESP withdrawals have an additional issue because it’s harder to delay withdrawal until your investments recover.
Here is an example. Your kid is 16. You are going to withdraw the RESP entirely over 4 years from age 18-22. That means the average dollar will be invested for 4 years. Based on history, the stock market has been up 89% of the time in 4-year periods with the typical total gain of 40-50%. There has been an 11% chance of a loss after 4 years with the worst loss being 6.8% per year or 25% in total.
It is very unlikely, but possible, that you have 25% less after 4 years. If that happens, how much of a problem is it for you? If it is a massive problem, then you may want to invest partly in fixed income or cash. That means you give up an 89% chance of a gain averaging 40-50%.
In practice for our clients, they don’t really know exactly what education will cost. Which program will they go into? Will they live at home or in residence? Most also expect their kids to pay part of the cost in order to learn some money skills. They can do this with a part-time job and a student loan.
There is some room to delay withdrawals. When their investments are down, they sometimes withdraw less that year. You need to withdraw everything from the RESP before your last child finishes university. However, you can withdraw from the RESP and buy similar investments in an “in trust for” (ITF) account for your child just until the markets recover.
Our clients have almost all stayed fully in equities right to the end. They are nearly always rewarded for this. If investments are down a lot, we would look for methods to stay invested until there is a recovery.
These types of situations have to be looked at uniquely for every client. For most, all equities is the best, but not for everybody.
While holding bonds in a portfolio can reduce volatility caused by the stock market, given the extremely low interest rates and twelve plus years timeline for our kids’ RESPs, I started to think that holding an all equity ETF makes more sense.
So, which all equity ETF should we consider? For Canadians, Vanguard, iShares, and Horizons offer all equity ETFs that are very similar. Let’s take a look at these all equity ETFs and compare them.
Vanguard All Equity ETF Portfolio – VEQT
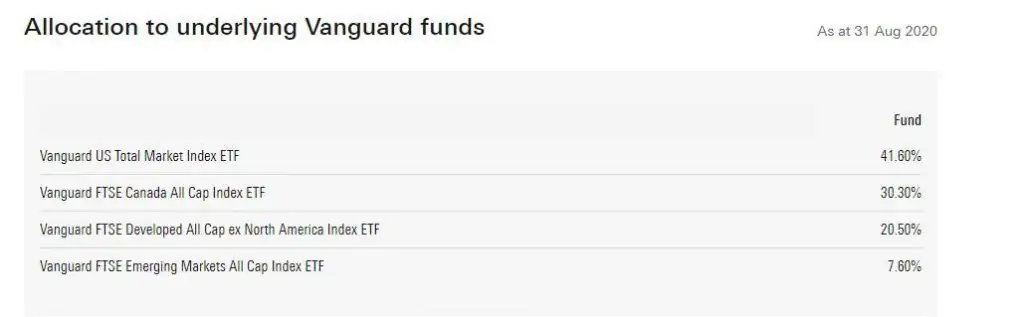
Vanguard All-Equity ETF Portfolio seeks to provide long-term capital growth by investing primarily in equity securities.
- MER: 0.25%
- Inception Date: Jan 29, 2019
- Distribution: Annually
- Number of stocks: 12,649
- Underlying ETFs:
- Vanguard US Total Market Index ETF (VUN) – 41.60%
- Vanguard FTSE Canada All Cap Index ETF (VCN) – 30.30%
- Vanguard FTSE Developed All Cap ex North America Index ETF (VIU) – 20.50%
- Vanguard FTSE Emerging Marketing All Cap Index ETF (VEE) – 7.60%
One thing I noted is VEQT has a turnover rate of 15.9% as of June 30, 2020. This seems quite high. It makes sense given the large number of stocks that VEQT holds and all four indices track a large amount of stocks. This is probably why VEQT has the highest MER out of all three all equity ETFs.
VEQT Top 10 Market Allocation
Here is VEQT’s top 10 market allocation. As we can see, the fund has a large exposure to the North American market.
- US: 41.7%
- Canada: 30%
- Japan: 5%
- China: 3.3%
- UK: 2.8%
- France: 1.8%
- Germany: 1.8%
- Switzerland: 1.8%
- Australia: 1.4%
- Taiwan: 1.2%
VEQT Sector Exposure
In terms of sector exposure, VEQT has somewhat a balanced exposure with Financial Services and Technology taking the lead. Please note, I took the sector exposure data from Morningstar so allow for an apples to apples comparison between the three all equity ETFs.
- Financial Services: 19.22%
- Technology: 15.73%
- Industrials: 10.96%
- Health Care: 9.82%
- Consumer Cyclical: 8.96%
- Communication Services: 7.5%
- Basic Materials: 7.23%
- Consumer Defensive: 7.19%
- Energy: 6.62%
- Utilities: 3.45%
- Real Estate: 3.31%
VEQT Top 10 Holdings
Due to the high North American exposure and high exposure in Financial Services and Technology, I was curious to find out about VEQT’s top 10 holdings.
- Apple: 2.41%
- Microsoft: 2.04%
- Shopify: 1.99%
- Royal Bank: 1.93%
- Amazon: 1.75%
- TD: 1.60%
- Candian National Railway: 1.32%
- Enbridge: 1.15%
- Barrick Gold: 0.93%
- Bank of Nova Scotia: 0.93%
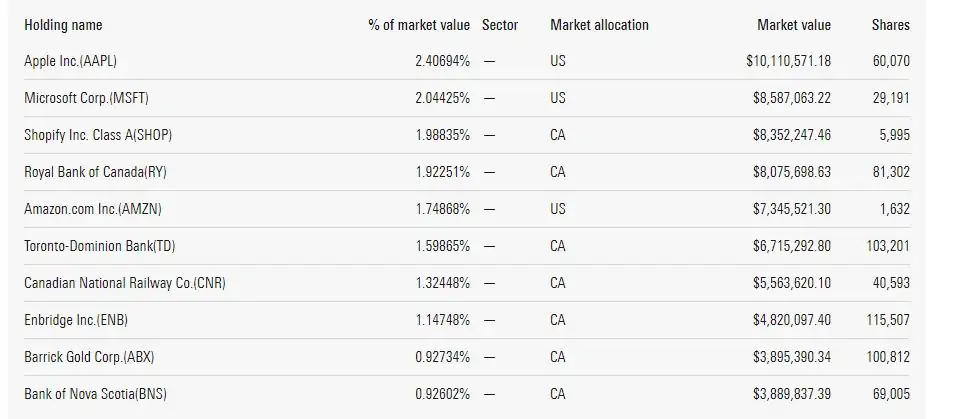
The top five holdings are dominated by tech stocks. Royal Bank, TD, and Bank of Nova Scotia are part of the top 10, which demonstrates the strength of the Canadian banks.
Considering technology stocks like Facebook, Alphabet, and Tesla have been doing quite well, it’s interesting that these stocks are not on VEQT’s top 10 holdings. In case you’re curious, Facebook is #11, Alphabet is #18 (Class A shares) and #20 (Class B shares), and Tesla is #28.
In case you wanted to examine VEQT further, I have written an in depth VEQT review where I went over the different aspects of VEQT.
iShares Core Equity ETF seeks to provide long-term capital growth by investing primarily in one or more exchange-traded funds managed by BlackRock Canada or an affiliate that provides exposure to equity securities.
- MER: 0.20%
- Inception Date: Aug 7, 2019
- Distribution: Quarterly
- Number of stocks: 9,044
- Underlying ETFs:
- iShares Core S&P Total US Stock (ITOT) – 47.15%
- iShares MSCI EAFE IMI Index (XEF) – 23.76%
- iShares S&P/TSX Capped Composite (XIC) – 23.62%
- iShares Core MSCI Emerging Markets (IMEG) – 5.16%
iShares does not disclose the turnover rate for XEQT. Since this all equity ETF holds 3,605 fewer stocks or 28% less compared to VEQT, I would assume XEQT to have a lower turnover rate than VEQT.
XEQT Top 10 Market Allocation
Here are the top 10 market allocation for XEQT.
- US: 46.23%
- Canada: 22.94%
- Japan: 6.4%
- UK: 3.04%
- Switzerland: 2.51%
- China: 2.31%
- France: 2.18%
- Germany: 2.09%
- Australia: 1.8%
- Netherlands: 1.22%
Sharp eyed readers will notice that while XEQT holds 47.15% in the iShares S&P US Total Market ETF (ITOT), the US exposure is only 46.23%. This is probably because XEQT holds about 0.31% of the fun in cash.
XEQT Sector Exposure
When it comes to sector exposure, XEQT holds a similar percentage in Financial Services and Technology.
- Financial Services: 16.92%
- Technology: 16.84%
- Industrials: 11.26%
- Healthcare: 10.63%
- Consumer Cyclical: 9.96%
- Communication Services: 8.26%
- Consumer Defensive: 7.5%
- Basic Materials: 6.89%
- Energy: 4.58%
- Real Estate: 3.61%
- Utilities: 3.56%
XEQT Top 10 Holdings
XEQT’s top 10 holdings are slightly different compared to VEQT. Facebook made it to the top 10 list.
- Apple: 2.53%
- Microsoft: 2.23%
- Amazon: 1.87%
- Royal Bank: 1.41%
- Shopify: 1.38%
- TD: 1.15%
- Canadian National Railway: 1.06%
- Facebook: 0.87%
- Enbridge: 0.84%
- Bank of Nova Scotia: 0.69%
Once again, the likes of Alphabet and Tesla are not part of XEQT’s top 10 holdings.
In case you wanted to examine XEQT further, I have written an in depth XEQT review where I went over the different aspects of XEQT.
Horizons All-Equity Asset Allocation ETF (HEQT)
Horizons All-Equity Asset Allocation ETF seeks long-term capital growth using a portfolio of primary equity-focused total return index exchange traded funds. When HEQT was first launched, it had the ticker HGRO but later changed to HEQT.
- MER: 0.20%
- Inception Date: Sep 13, 2019
- Distribution: Monthly
- Number of stocks: 0
- Underlying ETFs:
- Horizons US Large Cap Index ETF (HULC) – 32.92%
- Horizons NASDAQ-100 Index ETF (HXQ) – 22.83%
- Horizons INTL Developed MKTS (HXDM) – 20.83%
- Horizons S&P/TSX 60 Index ETF(HXT) – 16.28%
- Horizons Euro Stoxx 50 index ETF (HXX) – 6.71%
Yup, you read that right, HEQT doesn’t hold any stocks. The five underlying ETFs that HEQT holds are known as Horizons Total Return Index ETFs. Most of these Horizons Total Return Index (TRI) ETFs utilize a synthetic structure, known as a total return swap.
HEQT Market Allocation
Below is the HEQT market allocation. Over half of its market allocation is in the US.
- US: 60.3%
- Canada: 17.06%
- Japan: 5.32%
- UK: 3.17%
- Switzerland: 2.41%
- France: 2.26%
- Germany: 2.06%
- Australia: 1.49%
- Netherlands: 1.07%
- Sweden: 0.67%
HEQT Sector Exposure
Because Horizons does not provide the HEQT’s sector exposure on their website, I had to rely on Morningstar. Below is HEQT’s sector exposure according to Morningstar.
- Technology: 24.22%
- Financial Services: 13.88%
- Communication Services: 11.47%
- Consumer Cyclical: 11.46%
- Healthcare: 10.40%
- Industrials: 8.4%
- Consumer Defensive: 7.24%
- Basic Materials: 4.45%
- Energy: 3.87%
- Utilities: 2.73%
- Real Estate: 1.88%
Because HEQT holds both the US Large Cap Index and the NASDQA-100 Index, this all equity ETF is dominated by the Technology sector with Financial Services in second place.
HEQT Top 10 Holdings
Since HEQT does not actually hold any stocks, it is not possible to determine the top 10 holdings. For this analysis, I looked at the top 10 holdings for HULC, HXQ, HXT, then calculated the corresponding percentages accordingly. This may not be 100% accurate since there’s no information on HXDM’s top 10 holdings. Not to mention that none of the HEQT’s underlying index ETFs actually hold any stocks. But for comparison purposes, let’s allow this calculation.
- Apple: 5.46%
- Microsoft: 4.38%
- Amazon: 4.14%
- Facebook: 1.81%
- Alphabet: 2.69% (Class A: 1.36%, Class B: 1.33%)
- Shopify: 1.32%
- Royal Bank: 1.24%
- TD: 1.03%
- Nvidia: 0.80%
- Adobe: 0.46%
The top 10 holdings of HEQT consists of a lot of tech stocks. Royal Bank and TD are the only non-tech stocks. Since I can’t find any info on HXDM’s top 10 holdings, it is possible that some international stocks may constitute one of HEQT’s top 10 holdings.
All Equity ETFs Comparison – VEQT vs. XEQT vs. HEQT
So which of these all equity ETFs should we pick? Let’s compare VEQT vs. XEQT vs. HEQT and see which one is most suitable.
A high level comparison between VEQT, XEQT, and HEQT.
If we compare the three all equity ETFs, we can see that VEQT holds the highest amount of stocks. XEQT holds over 9,000 stocks but about 28% less compared to VEQT. Meanwhile, HEQT does not technically own any stocks via the weird total return swap structure. Therefore, in terms of stock diversification, VEQT is the best, XEQT sits in the middle, and HEQT is probably the worst.
HEQT has very low average trading volume compared to VEQT and XEQT. For stocks, the low volume/liquidity can be a concern as it typically means a high bid-ask spread. It also means that it is harder to buy and sell the low volume traded stocks. However, Dan at Canadian Couch Potato, the low trading volume for ETFs shouldn’t be a concern. Afterall, people usually hold ETFs over a very long term rather than trading in and out ETFs regularly.
HEQT’s net assets are also a lot lower than XEQT even though the two ETFs started only a month apart. Do people not know about HEQT? I am not sure why HEQT’s net assets are so much lower. It is possible that Canadians simply don’t like the total return swap set up that Horizons utilitize for these TRI index ETFs.
| Number of Stocks | MER | # of funds | Distribution Frequency | Inception Date | Average Volume | Net Assets | |
| VEQT | 12,649 | 0.25% | 4 | Annually | Jan 29, 2019 | 40,488 | $419.7M |
| XEQT | 9,044 | 0.20% | 4 | Quarterly | Aug 7, 2019 | 29,364 | $100.8M |
| HEQT | Unknown (at least 210) | 0.17% | 5 | Monthly | Sep 13, 2019 | 2,830 | $7.4M |
All three of the all equity ETFs are relatively new. If VEQT, XEQT, and HEQT continue to be popular, I would expect the likes of BMO and TD to create similar all equity ETFs to compete against Vanguard, iShares, and Horizons.
If I had to pick one all equity ETF out of these three without looking at the other parameters, I would probably pick XEQT since it sits in the middle of all three ETFs.
VEQT vs. XEQT vs. HEQT – Market Allocation Comparison
The three all equity ETFs are constructed differently so they have different market allocation.
| VEQT | XEQT | HEQT | |
| 1 | US: 41.7% | US: 46.23% | US: 60.3% |
| 2 | Canada: 30% | Canada: 22.94% | Canada: 17.06% |
| 3 | Japan: 5% | Japan: 6.4% | Japan: 5.32% |
| 4 | China: 3.3% | UK: 3.04% | UK: 3.17% |
| 5 | UK: 2.8% | Switzerland: 2.51% | Switzerland: 2.41% |
| 6 | France: 1.8% | China: 2.31% | France: 2.26% |
| 7 | Germany: 1.8% | France: 2.18% | Germany: 2.06% |
| 8 | Switzerland: 1.8% | Germany: 2.09% | Australia: 1.49% |
| 9 | Australia: 1.4% | Australia: 1.8% | Netherlands: 1.07% |
| 10 | Taiwan: 1.2% | Netherlands: 1.22% | Sweden: 0.67% |
All three ETFs have a high concentration in the North American market. HEQT has the highest exposure to the US market while XEQT has the lowest.
What about exposure to the ex-North American market?
- VEQT: 28.1%
- XEQT: 28.92%
- HEQT: 27.54%
Given HEQT’s high exposure to the US market, it is not a surprise it has the lowest exposure to the ex-NAM market. Between VEQT and XEQT there’s less than a 1% difference. We’d pick XEQT if we want to pick an all equity ETF that is diversified outside of Canada. I would be a little hesitant picking HEQT because it is so highly concentrated in the US.
VEQT vs. XEQT vs. HEQT – Sector Exposure
Here is the sector exposure comparison between the three all equity ETFs. Please note, I used the sector exposure breakdown from Morningstar so we can have a fair comparison between the three ETFs.
| VEQT | XEQT | HEQT | |
| Basic Materials | 7.23% | 6.89% | 4.45% |
| Consumer Cyclical | 8.96% | 9.96% | 11.46% |
| Consumer Defensive | 7.19% | 7.5% | 7.24% |
| Communication Services | 7.50% | 8.26% | 11.47% |
| Energy | 6.62% | 4.58% | 3.87% |
| Financial Services | 19.22% | 16.92% | 13.88% |
| Healthcare | 9.82% | 10.63% | 10.40% |
| Industrials | 10.96% | 11.26% | 8.40% |
| Real Estate | 3.31% | 3.61% | 1.88% |
| Technology | 15.73% | 16.84% | 24.22% |
| Utilities | 3.45% | 3.56% | 2.73% |
From the sector exposure point of view, HEQT is highly concentrated in Technology. This makes sense since HEQT holds both the US Large Cap Index and NASDAQ-100 Index and there are some overlaps in these ETFs. For example, Apple, Microsoft, Amazon, Facebook, Alphabet, and Tesla are all in the top 10 holdings of these two indices. As a result, the exposure to these technology stocks are inflated. Since these technology stocks are known for their high betas, I would assume that HEQT may have higher volatility compared to the other two all equity ETFs. I’d also guess HEQT to have slightly higher returns due to the higher exposures to these technology stocks.
Given how poorly the Energy sector has performed lately, it is slightly worrisome to see VEQT with the highest exposure in the Energy sector. This is probably caused by VEQT having the highest exposure to the Canadian market compared to the other two ETFs. It is a well known fact that the Canadian market consists of a large percentage of companies in the Energy sector. So, by having more exposure to the Canadian market, it probably causes VEQT to have a higher exposure to the Energy sector.
If we lump Consumer Defensive, Healthcare, and Utilities together as part of the Defensive sectors, XEQT takes the lead at 21.69%, VEQT in second at 20.46%, and HEQT in third at 20.37%. With around 1% difference between the three ETFs, I would conclude that all three of these all equity ETFs are well exposed to the Defensive Sector.
VEQT vs. XEQT vs. HEQT – Top 10 Holding Comparison
A word of caution, since HEQT does not have details on the top 10 holdings, I did some calculation myself to determine the list. This is my best educated guess.
| VEQT | XEQT | HEQT | |
| 1 | Apple 2.41% | Apple: 2.53% | Apple: 5.46% |
| 2 | Microsoft: 2.04% | Microsoft: 2.23% | Microsoft: 4.38% |
| 3 | Shopify: 1.99% | Amazon: 1.87% | Amazon: 4.14% |
| 4 | Royal Bank: 1.93% | Royal Bank: 1.41% | Facebook: 1.81% |
| 5 | Amazon: 1.75% | Shopify: 1.38% | Alphabet: 2.69% (Class A: 1.36%, Class B: 1.33%) |
| 6 | TD: 1.60% | TD: 1.15% | Shopify: 1.32% |
| 7 | Candian National Railway: 1.32% | Canadian National Railway: 1.06% | Royal Bank: 1.24% |
| 8 | Enbridge: 1.15% | Facebook: 0.87% | TD: 1.03% |
| 9 | Barrick Gold: 0.93% | Enbridge: 0.84% | Nvidia: 0.80% |
| 10 | Bank of Nova Scotia: 0.93% | Bank of Nova Scotia: 0.69% | Adobe: 0.46% |
| Total % | 16.05% | 14.03% | 23.33% |
Between VEQT and XEQT, the top 10 holdings are very similar. Barrick Gold and Facebook interchanged each other between the two all equity ETFs. XEQT has a slightly higher exposure to tech stocks in the top 10 (8.88%) compared to VEQT’s 8.19%. Meanwhile, VEQT has a higher exposure to Canadian non-tech stocks at 7.86% compared to XEQT’s 5.15%. This shouldn’t come as a surprise considering VEQT’s holds 30.30% in VCN and has a higher exposure to the Canadian market.
HEQT has a very high exposure to tech stocks in the top 10 at 21.06%. Its top 10 holdings consist of 23.33% of the fund. The only non-tech stocks are Royal Bank and TD which add up to merely 2.27%. Since tech stocks have a tendency to go bonkers both gain and loss wise, I would expect HEQT to have higher returns but perhaps higher losses compared to VEQT and XEQT. Perhaps HEQT may not be for the faint of hearts?
VEQT vs. XEQT vs. HEQT- Returns Comparison
Since three all equity ETFs have different makeups and different inception dates, it’d be interesting to compare their returns. For this comparison we will take a look at the returns between Sep 19, 2019 to Sep 25, 2020 between all three ETFs (Yahoo Finance only has HEQT closing price from Sep 19, 2019). During this time period there were a few interesting dates:
- Feb 20, 2020 – 52-week-high for most market indices
- March 23, 2020 – 52-week-low for most market indices
- Aug 28, 2020 – 52-week-high for the S&P 500
Here are the three ETFs’ prices for the five dates we picked and the respective returns in percentage compared to the starting date.
| VEQT | VEQT % | XEQT | XEQT % | HEQT | HEQT % | |
| 19-Sep-19 | $27.56 | N/A | $20.76 | N/A | $9.97 | N/A |
| 20-Feb-20 | $29.65 | 7.58% | $22.47 | 8.24% | $11.22 | 12.54% |
| 23-Mar-20 | $20.69 | -24.93% | $15.85 | -23.65% | $7.65 | -23.27% |
| 28-Aug-20 | $29.40 | 6.68% | $22.07 | 6.31% | $11.60 | 16.35% |
| 25-Sep-20 | $28.43 | 3.16% | $21.63 | 4.19% | $11.00 | 10.33% |
Due to the higher concentration of tech stocks, it is not a surprise to see HEQT having a higher overall return compared to VEQT and XEQT in the same time period. Afterall, Apple, Amazon, Facebook, Shopify, Nvidia and other tech stocks have done very well during the last year.
One thing to consider is that I have only compared a year worth of data, this comparison isn’t the most scientific and may not be a true reflection of how these three all equity ETFs would perform moving forward.
Comparing between VEQT and XEQT, we can see that XEQT performed better. This is expected given that XEQT has a higher US exposure and VEQT has a higher Canadian exposure. Since the Energy sector has performed poorly in 2020, and that the Canadian market consists of a high percentage of Energy stocks, VEQT’s lower performance makes sense.
How does XGRO compare to the all equity ETFs?
Just for fun, let’s compare XGRO with these three all equity ETFs.
| XGRO | % | VEQT % | XEQT % | HEQT % | |
| 19-Sep-19 | $20.82 | N/A | N/A | N/A | N/A |
| 20-Feb-20 | $22.24 | 6.82% | 7.58% | 8.24% | 12.54% |
| 23-Mar-20 | $16.52 | -20.65% | -24.93% | -23.65% | -23.27% |
| 28-Aug-20 | $22.09 | 6.10% | 6.68% | 6.31% | 16.35% |
| 25-Sep-20 | $21.48 | 3.17% | 3.16% | 4.19% | 10.33% |
Given that XGRO holds 80% equities and 20% bonds, it makes sense that XGRO didn’t return as high on Feb 20, 2020 and didn’t perform as poorly on Mar 23, 2020 when compared to the three all equity ETFs.
It is, however, interesting to see that XGRO has performed just as well compared to VEQT during the same time period (+3.17% vs. +3.16%). I’m not exactly sure why this is the case…
There’s no debate that stocks will provide higher returns over the long term compared to bonds and other safe investment vehicles like GCI’s. With an investment timeline of more than twelve years, it does make more and more sense to hold 100% stocks in the RESPs to produce a higher return.
VEQT vs. XEQT vs. HEQT – Which one to pick?
So, between the three all equity ETFs, VEQT, XEQT, and HEQT, which one should we pick for our kids’ RESPs?
Before answering that question, let’s take a quick look at MER fees. The differences in management fees between these three all equity ETFs are very small. The annual fees would be the following for different portfolio sizes:
| $250k portfolio MER fees | $500k portfolio MER fees | $750k portfolio MER fees | |
| VEQT | $625 | $1,250 | $1,875 |
| XEQT | $500 | $1,000 | $1,500 |
| HEQT | $425 | $850 | $1,275 |
The MER fee differences are in the few hundred dollar range, so it’s not that significant given the size of the portfolio. I’d be very happy if our RESPs end up greater than $250k by the time our kids start post secondary education.
Therefore, it is more important to pick an all equity ETF that would fit our investment strategy.
VEQT is an all-around all equity ETF that provides the best diversification. Vanguard has been managing ETFs for a very long time and they certainly have created a great product with VEQT. If we are looking for an all equity ETF with the best diversification, VEQT is a great fit.
XEQT sits in the middle when it comes to these three all equity ETFs. It is reasonably diversified, and provides a middle of the pack return. It has a higher exposure to the US than VEQT and has the highest exposure to the ex-NAM market out of all three all equity ETFs that we compared.
HEQT has the lowest MER and has a high concentration on the Tech sector. In the time period that we examined, HEQT had a higher return compared to the other two all equity ETFs. I believe the higher exposure to tech stocks can lead to higher volatility. My main concern with HEQT is the total return swap structure that Horizons use. The idea of an index ETF not owning any actual stocks doesn’t sit very well for me. This seems to contradict the point of holding an index ETF.
Therefore, I would pick XEQT as the all equity ETF to hold in our kids’ RESP. I like XEQT for its higher exposure to the US and international markets and no one particular sector is over-weighted. I also like XEQT holds over 9,000 stocks and the top 10 holdings only make up 14.03% of the fund. In other words, the fund is well diversified.
Our new RESP strategy – Holding an all equity ETF
So our “new” new RESP strategy is to hold an all equity ETF rather than relying on XGRO for the immediate future. With that in mind, we plan to hold the following:
| Index | 0-15 Yrs | 15-17 Yrs | 18+ Yrs |
| XEQT | 100% | 50% | 0% |
| XGRO | 0% | 50% | 100% |
So for three years, our RESP’s bonds exposure would be 10%. We would increase the exposure to 20% once the kids turn 18 years old. This would allow us to stay in mostly stocks. Having said that, this plan isn’t set in stone and we may revisit and alter this strategy in the future. Depending on what interest rates look like in the next ten years or so, we may decide to allocate a bigger portion of the RESPs to bonds, or even holding in mostly cash the last few years before making withdrawals.
Dear readers, are you utilizing an all equity ETF in your investing portfolio? What do you think about our new RESP strategy?
Hi Bob, I went back & looked this article up, today in June 2026 would you still go the XEQT route for someone just opening an RESP? Im just thinking US exposure & Tech exposure? Or have I missed a more recent discussion?
Yes, 100%, will still go with XEQT. That’s what we’re doing for our RESPs.
HEQT is monthly dividends now, and should be entirely cap gains/ return of capital since its underlying are Total Return (and don’t pay dividends)…
Thanks for pointing that out.
Would love to read your thoughts with an updated review after HGRO became HEQT.
Hi Sam,
Good point, probably a good idea to update this article one of these days.
Hello Tawcan,
I really like your articles and yes, your advice is influencing many. I particularly like how you shared your new RESP strategy, and I really appreciate having some direction about that. I am not sure if you have published it somewhere, but do you have a similar RRSP strategy that you can share?
Thank you.
Hi Leo,
Thank you. You can check out the following articles:
https://tawcan.com/revisit-our-financial-independence-assumptions/
https://tawcan.com/early-withdrawal-strategies-readers-discussion/
https://tawcan.com/living-off-dividends-tax-free/
https://tawcan.com/living-off-dividends-tax-free-2/
Hope this helps.
Hi Bob,
Thanks for your beneficial insights.
Can you recommend to me a tax accountant (preferably in Montreal), who is knowledgeable in tax implications on stocks and etf’s realized gain/loss to fill my income tax return.
Hi Ali,
You’re welcome. Sorry, I don’t know any tax accountants in Montreal.
Hello, First of all thank you very much for all of this information and research. I am also trying to do a good job with my children’s RESP account. You posted an article on xeqt vs veqt and I have been provided some conflicting information by my accountant and I am trying to understand what information is correct. You mentioned a foreign tax implication in your RRSP if holding XEQT.to but my accountant told me this recently. “The tax treaty between US and Canada grants a US tax exemption for foreign investments held within a RRSP (but not a TSFA, which is not recognized by the US). So, it’s totally ok to hold foreign investments in an RRSP, as no tax is deducted at source on foreign income in a RRSP.” I wonder if you could help me get to the bottom of that so I could make sure I understand it correctly. I am considering XEQT for my RRSP, TFSA and RESP and regular taxable account.
Hi John,
Your accountant is right but in the case of ETFs, the distributions that you receive are the net after 15% withholding tax is taken out. If you hold anything other than non-registered, you won’t be able to recover the tax in the form of the foreign tax credit. You may want to take a look at the foreign tax calculator here – https://www.canadianportfoliomanagerblog.com/calculators/
For example, for XEQT the foreign withholding tax ratios are:
TFSA: 0.22%
RRSP: 0.22%
Taxable: 0.01%
It’s a very small amount so I really wouldn’t worry too much about it. Hope this helps.
Thank you, I found this very helpful!
You’re welcome.
Great write-up Tawcan.
Regarding HGRO:
According to the prospectus of the underlying Horizons benchmark ETFs, the NASDAQ-100 Index ETF (HXQ) and US Large Cap Index ETF (HULC) were specifically noted as NOT employing a total return swap arrangement but rather investing directly in the underlying securities.
The prospectus for the HGRO ETF itself does not clearly make this distinction.
As HGRO holds ~56% across HXQ and HULC, the majority of the ETF is indirectly holding the underlying equities. Not sure if that changes your mind! Regardless, excellent analysis – keep up the great work 🙂
Hi Bob,
If I intend to buy individual Canadian bank stocks in CAD$, which shares exactly I should buy: for example for BMO what shares I buy: BMO or BMO.PR.Aor BMO.PR.B or BMO.PR.C or BMO.PR.E…etc?!
Please give me the exact ticker symbol for the shares of BMO, CM, RY, BNS, TD that I should buy. My aim is high yield dividends and growth in stock value.
I appreciate your feedback
Al Be
Hi Al,
You want BMO.TO, CM.TO and etc.
BMO.PRA, BMO.PR.B, and all those tickers are preferred shares.
Thanks Bob, I tried to look for it in the search to read about it, but BMO.TO doesn’t exist!
The same with other Canadian banks, I found: CM, RY, TD, BNS. The tickers like: BMO.TO, CM.TO, RY.TO, TD.TO, and BNS.TO doesn’t exist!
Any idea?!
Appreciate your advise.
Al BE
I’m not sure where you’re searching. For example, from Yahoo Finance – https://finance.yahoo.com/quote/BMO.TO?p=BMO.TO&.tsrc=fin-srch
BMO.TO, CM.TO, RY.TO, etc are the correct trading symbols do use. The .PR tickers mean they are preferred shares.
Thanks Bob for your reply.
I wonder which trading platform you use for trading?!
I appreciate your reply.
Al B.
Hi Bob,
Thanks for your great article and for the insight you provided us with.
I am a new investor already retired with minimal income. I have some savings which I am looking to invest in order to generate income for me and my wife and to grow it. Since I am somehow conservative in my investment, I am looking mostly for different ETF’s including Canadian Banks index ETF (QQQ, TQQQ, XIU, VTV, VOO, RBNK or ZEB….), and maybe some individual stocks which yield good dividends (I am thinking: Telus corp, Pfizer, GSK, EPD…).
I appreciate your advise.
Al
Hi Al,
If you’re already retired, you should look into a more conservative ETF rather than an all equity ETF. So things like VBAL or VCNS might be a good choice. See here – https://tawcan.com/all-in-one-etfs-canada/
Hi Bob,
Just found your site and it’s been a great resource. I’m new to learning how to invest. I was planning to do a Roboadvisor for my son’s RESP but after reading this article, it seems very simple/sensible to do on my own and save myself the fees. I have also been debating between Vanguard vs IShare so thank you for your transparency as I will likely mirror the strategy you’ve discussed. Do you think this ETF strategy would also be a good plan for personal investing in TSFA?
Hi Twee,
You’re welcome. If you are OK with a little bit DIY, I think these all equity ETFs will be better than robo advisor (i.e. less fees). You can definitely use this ETF strategy for TFSA, RRSP, and taxable accounts if you want to keep things simple.
Thanks for your reply. I still have about 30 yrs before retirement and was thinking of being more conservative and just purchasing VGRO/XGRO. But with what you mentioned above, I think I should still be relatively “safe” to be more aggressive and follow the XEQT/XGRO asset allocation timeline you have planned which is based on <25 yrs timeframe.
New diy investor here. So if it’s time for you switch from 50% XEQT to 100% XGRO do you have to sell the XEQT and buy XGRO? Or can you just switch it just like Financial Institution does if you have mutual funds?
Hi Ana,
Yes, sell the XEQT and buy XGRO. Alternatively you can buy the bond ETFs that XGRO holds but that’d defeat the purpose of holding these all equity/all-in-one ETFs.
Doesn’t HGRO also have TER fees, which make it the most expensive one rather than the cheapest?
You’re correct! Thanks for pointing that out.
Thanks so much for your insights.
Do you have any comments regarding forward withholding taxes holding XEQT vs VEQT vs HGRO in a RESP account?
Thanks
You could take a look at this VEQT review, I broke down the withholding tax drag. There’s a calculator you can check in the article.
https://tawcan.com/veqt-review/
I wouldn’t worry too much about the withholding tax drag inside an RESP IMO.
Amazing analysis.
To me, the difference b/w VEQT and XEQT is definitely there but I don’t know how much it will impact that net return after 15+ years.
I like VEQT because I like Vanguard more. I’m also very aware of the fact that VEQT has way more stocks so it feels to me that it’s more diversified. I also am long on Canada (& Canadian Equities) and I believe and hope that if/when the Energy sector recovers VEQT has a chance to out-perform XEQT (but again, we’re talking a very small difference here) which is then offset by higher MER.
All two are good choices here. I’d pass on the HGRO and most folks are, given the $AUM.
Amazing article. Thanks for sharing!
XEQT has a bit higher exposure to the US market so in theory it should return a little bit better in the long run. But we’re probably talking a very smaller difference between the two.
Hey Bob,
thanks for the breakdown. Do you think there is any benefit if you buy xeqt, and still buy individual stocks/dividend stocks from the canadian market like RBC, Fortis? Or do you think that is too much overlap
Hi Justin,
I think there are still benefits. This is why we’re holding VCN/XAW and individual dividend stocks.
Is there an easy answer as to why? Is it better fees? Or just that you can tinker your allocation a bit more to your preference?
I’m currently debating selling the VCN+XAW that I have in both my RRSP and TFSA accounts in favour of just buying XEQT now, so I don’t have to track rebalancing.
But really, there’s not much difference in buying one vs two ETFs, so if there is benefit for me sticking with VCN+XAW, I’ll just keep doing that.
Yes better fees is one reason (i.e hold individual stocks). Imagine you’re living off your portfolio. If you own individual stocks and not sell (i.e. live off dividends), you aren’t paying transaction costs. However, with ETFs you’re paying management fees each year.
VCN + XAW is a great combo if you are OK with doing some re-balancing each year. Nothing wrong with that.
Very good analysis. Great job.
Hi there,
I am in the exact same boat right now and trying to figure out where to invest for my kid’s RESP and was thinking of an all-equity asset allocation etf afer listening to Ed Rempel at the Canadian Financial Summit, so thank you for this analysis!
A couple of questions, what do you mean your kids RESP will have 10% bond exposure for 3 years if you invest in XEQT, as it is all equity correct? Also, what will the tax look like on dividends from the US/International portion?
Thanks,
Mandeep
If we hold XEQT only then there’s no exposure to bonds. When we hold XGRO for 3 years we’d have 10% bond exposure. The dividends from the US/international portion gets taken care by the ETF already.
Thanks Bob. Can you explain more what you mean by “The dividends from the US/international portion gets taken care by the ETF already.” So the tax is deducted, but how much is it? Also, do you recommend setting up a DRIP?
The withholding tax on the dividends would be 15% correct?
Withholding tax is already being take care as part of the ETF distribution. You’d be able to recover it if you hold it in a taxable account (as foreign tax credit).
For us we’d always DRIP whenever we’re eligible.
We have our little one’s RESP in VEQT although I have to admit we didn’t do as thorough or an analysis before picking it as you did.
Great analysis and comparison.
Nicely done on investing in VEQT. I like to do my own analysis but I suppose sometimes I can overanalyze things. 🙂
Very detailed research into this for your kids RESP! I hope they know how lucky they are.
I know you did the comparison for your registered account but do you know what the tax implications would be if I held them in my non-registered account since they are made up of foreign, dividend paying and non dividend paying stocks?
I also share the same sentiment about HGRO.
The tax consequence would be very similar if you hold them in non-registered account. In fact, you might be able to recover some money as you’d get some foreign tax credit.
Nice article! Did you consider the impact on overall fees of the underlying holdings? In most cases, the wrapper cost will be all inclusive (i.e. high enough to cover the cost of the underlying ETFs, whose costs are rebated to avoid double charging the investor). For HGRO, however, a large percentage of the cost of the underlying ETF providing synthetic exposure via total return swap is the fee paid to the swap counterparty, which does NOT show up in the MER of the underlying funds and presumably will not be rebated by Horizons.
Looking at the ETF page for HGRO, it suggests that the fund will pay an aggregate TER of 0.28% based on the underlying ETFs held. This is quite a high figure were it just dealing with equity trading costs! However, since the fund only holds EFTs that obtain synthetic exposure via total return swap, we can infer that the TER is primarily composed of the swap fee associated with those transactions.
In my opinion, therefore, because the total return swap forms a core part of the structure of the ETF, these fees are not likely to materially decrease in future years. It makes sense to consider HGRO’s fees in light of both MER + ongoing swap fee costs, resulting in total costs of 0.45% annually.
The underlying ETF cost is already calculated in as part of the MER/management fee.
HGRO certainly has enticing fees but the idea of not actually owning anything doesn’t sound ideal to me. 🙂
I think HGRO is good for taxable accounts due to the benefits of deferred capital gains. The biggest risk is regulatory. Unsure if the government has done anything about it though.
0.45% annually is not bad given the above benefits in a taxable account no?
Agree that the biggest risk is regulatory for HGRO.
So is it confirmed that HEQT does not charge swap fees on top of the 0.20% mer? I’m struggling to find an answer to this.
That’s my understanding as well.
After emailing Horizon it was revealed to me that the mer of 0.20 on HEQT is the entire fee. There is no hidden swap fee or any other fees inherited from the underlying assets.
Good to know, thanks.
great research Bob ..
your kids are so lucky …
and you give added weight to the argument why i have gone to all equity ..
i am retired but i keep a large cash balance (also in case of buying more stocks )
i am an experienced investor so i don’t freak over volatility . in fact i bought a lot back in March which was a lucky/good move ..
the old 60/40 argument is dead .. and bonds no longer go in the opposite direction of stocks , they crashed also .
btw ,… Happy Thanksgiving from Victoria
Thank you. More than ever, it makes sense to do 100% stocks, especially when the kids are so young.