This post was originally published in 2016. The key formula used in the dividend spreadsheet template for dividend info from Google Finance was formulated back in 2014.
Due to the changes in Google Finance in March 2018, it was necessary to update the formula for pulling the dividend data. As you may know, pulling dividend data directly Google Finance no longer works.
After looking on the web, I found that Yahoo Finance is a good reliable alternate source to pull the dividend data from.
Jul 2020 Update: The ImportXML is having regular issues pulling data from Yahoo Finance due to Javascript. So this made the dividend spreadsheet template a bit unreliable.
Many users have reached out to me regarding this issue. After some research, rather than relying on the ImportXML function, I decided to update the dividend spreadsheet template with a different and more reliable function that’d do the exact same thing.
Dec 2020 Update: The ImportFromWeb add-on has a monthly pull limit. So if you check your portfolio regularly, by middle of the month, you won’t be able to see any dividend yield data. After experimenting a little bit, I decided to ditch ImportFromWeb and use another function called ImportHTML. ImportHTML is very similar to ImportXML but seems to be a bit more reliable.
Jun 2023 Update: Recently .UN tickers stopped working with Google Finance. I’ve found ways to workaround this. Scroll below to find out how.
Feb 2025 Update: Updated the formula to pull dividend info yet again. I have updated the template accordingly.
A while ago I shared my tutorial how to use Google Spreadsheet for dividend portfolio. In the tutorial, I resolved the key problem of the build-in GOOGLEFINANCE function – its inability to pull stock dividend information, to be more specific, dividend per share and dividend yield.
Although I shared the formula to pull dividend information automatically using Google Spreadsheet in the tutorial, many readers asked about sharing a dividend portfolio spreadsheet template that utilizes Google Spreadsheet to track their dividend portfolio and dividend income.
As you can see, this post is a bit long overdue (sorry!). After many months of revising my own Google spreadsheet dividend portfolio template, I thought it might be a good idea to write a “step by step guide” on how I created a Google finance dividend spreadsheet portfolio for tracking my own dividend portfolio and dividend income.
At the end of this post, I also shared a link for downloading the dividend Google spreadsheet template for free.
I’m a self-proclaimed Excel nerd. I love Google Spreadsheet because I can access the spreadsheet anywhere in the world, as long as there’s internet access (you can also enable offline mode so you can access the dividend spreadsheet without an internet connection). I really hope this step by step guide will help many of you.
Please note, since I am sharing the dividend investing template aka dividend tracker I use to track our dividend portfolio, the design is based on owning both US and Canadian listed dividend stocks. If you invest in a different currency, you should be able to easily modify the currency information.
Learning about dividend investing
If you’re reading this step-by-step guide. You are probably interested in dividend growth investing. Some here are great articles I have written in the past that you may find useful.
The first step when it comes to dividend growth investing and building your dividend portfolio is to determine how to start investing in dividend-paying stocks.
Eliminating stocks by looking at the different financial numbers is important but it is just as important to learn how to read the annual and quarterly reports. For Canadian dividend investors, you must understand how to build your portfolio so it can be as tax efficient as possible.
For further reading, please take a look at the following two FAQ’s I have put together:
- Dividend Investing FAQ (Mostly for Canadians but works for other countries too).
- Dividend & Index Investing FAQ.
Google finance dividend portfolio template and dividend tracker
Ok, let’s get back onto topic. Here is the step-by-step guide on how I created the Google dividend tracking spreadsheet.
Step 1: Create a Google Account
Most people have a Google account but if you don’t, create one so you can use Google Drive. Once you have an account, access your Google Drive and create a new Google Spreadsheet.
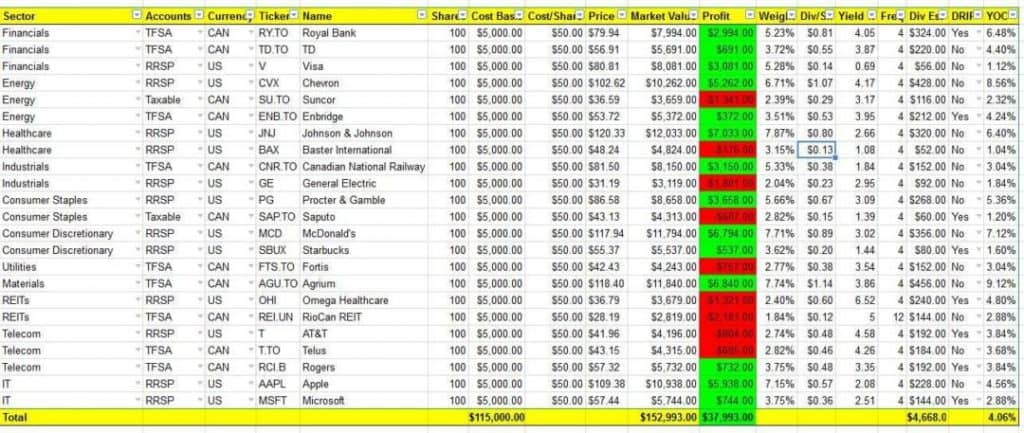
Step 2: Create headings for the Dividend Portfolio Template
The first sheet I rename it to Dividend Portfolio. I also create headings that I want to use to track my portfolio. After many changes, I decided to use the following headings:
- Sector: The sector the stock belongs to
- Accounts: Which accounts we hold the stock in
- Currency: Since we hold US and CAN listed stocks, this allows us to calculate the portfolio market value in Canadian currency
- Ticker: Stock ticker symbol
- Name: Name of the stock
- Shares: Number of shares we own
- Cost Basis: How much we paid to purchase the stock
- Cost/Share: Price per share that we paid for the stock
- Price: Current market price
- Market value: Current market value of the stock
- Profit: How much unrealized profit we are making
- Weight: Stock weight of the portfolio as a percentage
- Div/Sh: Div per share received per dividend payout
- Yield %: The current dividend yield of the stock
- Freq: How many times the stock pays dividend in a year (Update: This field is no longer needed in the new version of the template)
- Div Est: Estimated dividend payout for the year
- DRIP: Whether we are DRIPing the stock or not
- YOC: Yield on cost
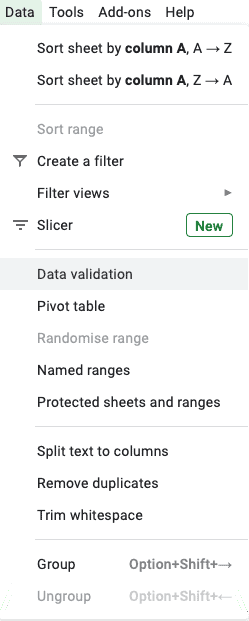
Step 3: Populate drop-down list
For headlines like Sector, Accounts, Currency, Ticker, and DRIP, I populated drop-down lists. To do so, select the desired rows then go to Data -> Validation. Under Criteria, select a List of items, then enter the desired items separated by columns.
I like the drop-down list as it saves quite a bit of time when entering data.
Step 4: Enter data
Enter the respective data in each row. Data like sector, accounts, currency, ticker, name, shares, cost basis, and DRIP should be pretty easy to enter.
The rest of the fields are calculated automatically based on a straight forward formula.
For Cost/Share, the formula that I used was for Cost Basis / Shares. For example, for Royal Bank, I entered “G3/F3.”
The two columns that required some data pulling are the Div/Sh and Yield columns. For those, I used the ImportXML function which I described in my original Google Spreadsheet tutorial.
For formula requires specifying XPath from Yahoo Finance. For some reason, I wasn’t able to incorporate it into the actual formula. So in the spreadsheet template, I am referencing a cell.
Also a key thing to note is that stocks with a “.” in their symbol are labelled differently for Google Finance and Yahoo Finance.
For example, Rogers would be RCI.B on Google Finance, but it would be RCI-B.TO on Yahoo Finance. Since we utilize GOOGLEFINANCE in the Price Column, and use Yahoo Finance to pull the dividend data, you will need to manually tweak the ImportXML formula slightly. Again, please refer to my original Google Spreadsheet tutorial for more information.
July 2020 Update: ImportXML has been consistently outputting N/A. This is caused by Yahoo Finance using a lot of Javascript so ImportXML cannot pull the dividend info reliably.
As a dividend investor, not having the dividend info in the dividend spreadsheet is not ideal. So I looked around to find an alternative.
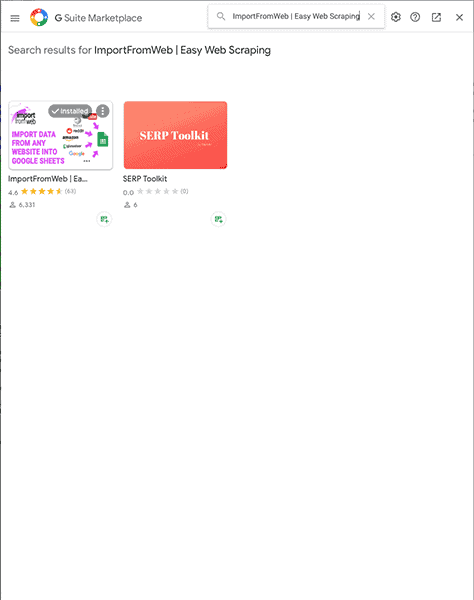
Fortunately, I found an alternative called ImportFromWeb. I have updated the spreadsheet and used an add-on function that’d do the same job. The add-on function is called “ImportFromWeb.” In order to use ImportFromWeb you need to do the following:
- Click on Add-ons and search for “ImportFromWeb”
- Install “ImportFromWeb” Add On
- Once it’s installed, you can replace “ImportXML” to “ImportFromWeb” in the formula
- Div & yields info should show up without any issues

For example:
ImportXML Formula: =split(IMPORTXML(concatenate(“https://finance.yahoo.com/quote/”,D5),$B$47),”()”)
ImportFromWeb Formula: =split(ImportFromWeb(concatenate(“https://finance.yahoo.com/quote/”,D5),$B$47),”()”)
Basically the formula is identical, we are just interchanging ImportXML and ImportFromWeb. You would continue to get the same dividend info in the Google dividend spreadsheet.
Note: ImportFromWeb will ask you for some access permission for your Google Account. If you’re not comfortable with this, do not use this add-on.
Dec 2020 Update: I received a lot of complains about using ImportFromWeb. First of all, some readers forgot to enable the add-on, rendering the spreadsheet somewhat useless. Then some readers found that they’d constantly use up the ImportFromWeb’s monthly limit, again, rendering the spreadsheet somewhat useless.
I started looking at an alternative way to pull dividend data into the spreadsheet and found that ImportHTML works pretty well.
So the spreadsheet has been updated to use ImportHTML.
ImportHTML Formula: =SPLIT(INDEX(IMPORTHTML(concatenate(“https://finance.yahoo.com/quote/”,D5),”table”,2),6,2),” “)
As you can see, it’s very similar to the old formula, expect pointing to an Xpath, I know pointing to the location of the table directly.
For those of you that are coders, you’ll notice that I’m still referencing the exact place in the code but using the HTML format rather than the Xpath format.
Jun 2023 Update: Recently, .UN tickers (FTS.TO too) stopped working with Google Finance. You can try using the following formula to pull price instead:
=INDEX(importhtml(https://www.morningstar.com/stocks/xtse/rei.un/quote”,”table”,1),2,2)
Change “rei.un” to the desired ticker Alternatively, you can also use this formula
Or this formula below:
=INDEX(importhtml(https://ycharts.com/companies/DIR.UN.TO/price,”table”,1),2,5)
Feb 2025 Update: I now use the following formula to pull dividend information (thanks to Reader Jeff for helping on this solution):
=SPLIT(importxml(concatenate(“https://ycharts.com/companies/“, D5, “/dividend”),”/html/body/main/div/div[4]/div/div/div/div[1]/div/h1/span”),”for”)
This formula splits out the ex dividend date too.
Step 5: Data conditional formatting
To make it easy to see whether you’re making a profit on a particular stock, I used conditional formatting to colour the Profit column red or green based on whether there’s any profit or not.
To do this, simply select data under Profit column, then go Format -> Conditional Formatting. A conditional format rules window will pop up on the right-hand side of the sheet.
The rule to use is “Format cells if Greater than or equal to 0.” Then I labelled the formatting style to use green. Next, I created another conditional format rule calling out “Format cells if less than 0” and labelled the formatting style to use red.
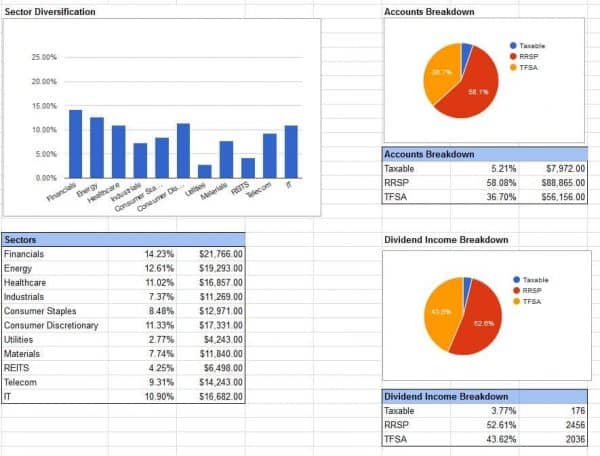
Step 6: Creating charts for the Dividend Portfolio Template
For this Google Spreadsheet dividend portfolio template, I created 3 charts to track Sector Diversification, Accounts Breakdown, and Dividend Income Breakdown. I like charts because they give good visual summaries.
To create these 3 charts, first I had to create three separate tables with the appropriate data. To get the data needed, I used a simple function called SUMIFS. Basically the function adds up a range depending on the criteria.
For example, to add up the market value of all dividend stocks in financial sectors I used the formula “SUMIFS(data in market value column, data in sector column, Financials).” (Actual formula: SUMIFS($J$3:$J$25,$A$3:$A$25,T19)
Next, I calculated the percentage of each headline.
Once I had the tables completed, I selected the data range I wanted to use, clicked on the Insert Chart button and inserted the desire chart type.

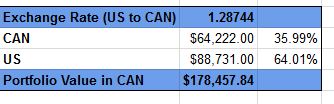
Step 7: Currency Exchange
Because our dividend portfolio has a mix of Canadian and US-listed stocks, I decided to show a breakdown and the market portfolio value in the Canadian dollar.
To query the current exchange rate, I used the function GoogleFinance(“CURRENCY:USDCAD”).
The SUMIFS function was utilized again to add up the market value of all Canadian and US stocks. With the US to CAN exchange rate available, I converted the US stock value into Canadian currency to show the entire portfolio value in the Canadian dollar. The breakdown percentages are also calculated in the table.
Geographical diversification is even more important than ever.
If you’re a Canadian, the last thing you want to do is investing 100% in Canadian stocks. This is another reason why utilizing an ex-Canada international index ETF like XAW or VXC is a good idea. It is also a good idea to purchase US dividend-paying stocks in your RRSP to avoid withholding taxes.
Step 8: Summary Report
I’m a very visual person so I like to have a summary report to see all the important numbers. Hence, for this Google Spreadsheet dividend portfolio template, I created a table to list all the important values like Book Value, Market Value, Profit, Estimated Annual Dividend, and YOC.
Step 9: Dividend Income
A dividend portfolio template is no good if you don’t have a sheet to track your annual dividend income. Hence I created a new sheet called dividend income to track annual dividend income.
A long time ago I used to only list the stock tickers in the dividend income sheet. But it was confusing for Mrs. T when I got her involved in tracking our household finance. So I added stock names to make it easier. 🙂
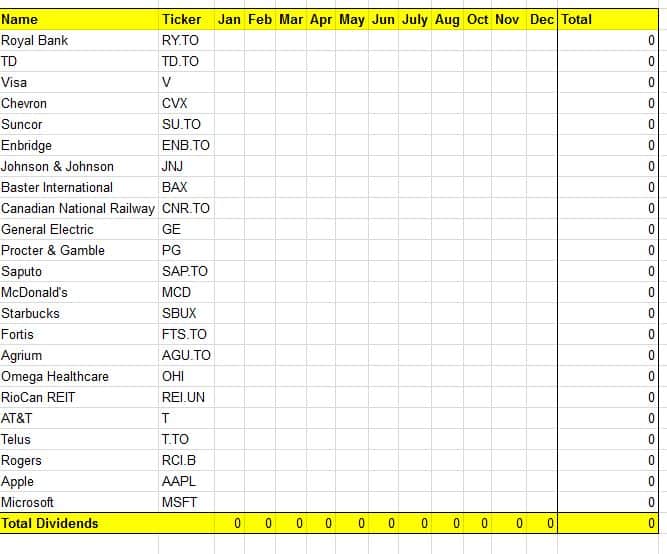
Whenever a stock pays dividends, you can populate the data under the respective month. Once the year is over, you can create another sheet to track the new year’s dividend income.
Possible Improvements for the dividend spreadsheet template
I personally use this dividend spreadsheet myself for tracking our dividend portfolio and found it extremely useful. There are some possible improvements to be made to the spreadsheet to make it even better though.
For example, being able to incorporate some or all of the parameters in the dividend scorecard so one can quickly analyze stocks in the dividend portfolio. In addition, some numbers that may be useful in the spreadsheet are:
- 5 year annualized dividend growth rate
- PE ratio for each stock
- 10 year average dividend yield percentage. This can be a good indicator on whether the stock is over-valued or not.
- Last dividend increase
- Dividend payout schedule
Some of these should be straight forward to implement (just takes time), some may take a bit of time. Once I have a bit more time, I may fine tune and improve the dividend spreadsheet template a bit.
Dec 2020 Update: I updated the spreadsheet and added a column for PE ratio.
Final Words – Dividend Portfolio Template (Dividend Tracker)
If you have read this far, you are probably wondering where’s the actual Google dividend spreadsheet template is.
Here is the free Google Finance Dividend Portfolio Template you can download. I have added a few notes in the document to answer some questions you might have.
Please feel free to play around with this spreadsheet and adjust things to your liking.
This is a long overdue post and I hope some of you will find this Google Finance dividend portfolio template useful. If you have any questions, please either comment below or send me an e-mail.
Even if you don’t have any questions, I would love to hear from you on what you think of the template or if there’s something you’d like me to add to the template.
Now if you are looking for tops 10 Canadian dividend stocks, top 10 Canadian dividend ETFs, top US dividend ETFs, and other ETFs to own. You can check out these pages.
- Best Canadian dividend stocks
- Best Canadian monthly dividend stocks
- Tops Canadian dividend ETFs
- Top US dividend ETFs
- Canadian Dividend Calendar
- Best Canadian utility stocks
- 6 Best Canadian Bank ETFs
- All-in-one ETFs comparision
- All Equity ETFs comparision
And if you’re doing index ETF investing, you might find the ETF Portfolio spreadsheet useful.
Thank you for taking the time to go through this step-by-step dividend spreadsheet template tutorial. If you have any questions, tips, or recommendations, feel free to contact me. I’d love to hear from you.
And please leave a comment on how you’re finding this dividend spreadsheet template!
Even by just copying your example spreadsheet I get the #ALL_SELECTORS_NOT_VALID result from all tickers. Can you test it yourself at the current state of your sheet and Yahoo to see if it still works on your end and suggest a solution please?
Did you use the ImportFromWeb add on? Did you click on the template link and made a copy yourself? Everything works fine on my end.
Yes Sir I copied your template into my own sheet, made sure I installed the add-on and so far all it gives me while loading the web data from Yahoo is that error message. Not just in your copied document but also when I implement the same feature in my own sheet.
Do I need to be a Premium member of Yahoo Finance to be allowed to run that specific query?
Hi,
You don’t need to be a premium member of Yahoo Finance. Does the copied template work for you before you copy things into your own sheet? It’s possible you don’t have the Xpath set up properly.
Thanks for the upgrade move to Search The Web as it resolves almost all of the issues. My only outstanding issue is that neither the old or new method using Search the Web work for General Dynamics (GD). Ever since I purchase some shares and added them to the spreadsheet over 1 year ago, it fails to return a dividend yield. Everything else works such as high price, low price, Beta, PE ratio, etc.. just not the yield. Any idea what this might be and why specific to GD ?
Weird, not sure why GD wouldn’t work since the Xpath is the same as other stocks.
Hello
I have the same problem with Ford and GM. All other stocks, etc show up except those 2 where I get NA for dividends, yield and the other parameters associated with dividends. It used to work find with the old formula, but now even that does not work for these two.
BTW, I finally figured out how to change the formula – The add on had to be searched for as it was not on the first drop down screen – and just replacing IMPORTXML with the newer formula got everything working again (with the exception above). It would have been nice for someone to explain in plain English those steps instead of talking about “X path” and other functions of which, I suspect, a lot of us have no understanding.
Hi Jim,
XPath is simply the location of the information on a certain website. You can think of it as the “address” for the info you’re looking for.
Hi,
People from 2020 who are facing problem with IMPORTXML, can use IMPORTFROMWEB instead.
You need to download this addon from the addon tab.
=split(IMPORTFROMWEB(concatenate(“https://finance.yahoo.com/quote/”,D6),”//*[@id=’quote-summary’]/div[2]/table/tbody/tr[6]/td[2]”),”()”)
It’s working fine for me.
Thanks I’ll give this a try in the spreadsheet.
Hi there, I am getting an “#ALL_SELECTORS_NOT_VALID” error message returned when using
=split(IMPORTFROMWEB(concatenate(“https://finance.yahoo.com/quote/”,A4),”//*[@id=’quote-summary’]/div[2]/table/tbody/tr[6]/td[2]”),”()”)
I tried re-generating the X-path without success…
I was able to get it to work by using the full XPath:
/html/body/div[1]/div/div/div[1]/div/div[3]/div[1]/div/div[1]/div/div/div/div[2]/div[2]/table/tbody/tr[6]/td[2]
So, the good thing is it’s working !
Not all of us are as computer literate as you are. I can find no such item in the addons tab on the spreadsheet. I use a Mac if that makes a difference. Lets try the step1-2-3 method in plain english so I can figure out what you are saying and make the corrections. BTW, I have no idea of what the X path is and don’t plan on becoming a programmer to find out. So again – plain and simple explainations would be very helpful to the non-computer literate. Thank you
I’ll try to update the guide to provide more technical explaination.
Hi,
I am still trying to get dividend yield/share and dividend yield % to work in my google sheets spreadsheet.
The example form I downloaded just says #VALUE for the BCE stock (one of the ones I own) so I’m not able to use the formatting from your example sheet in my own.
I can see the information you posted here
https://www.tawcan.com/using-google-spreadsheet-dividend-investment/
but I cannot get it to work as I would need to add any xpath information into a separate sheet because everything else has formulae for me and I am new to both excel and google sheets.
The one I am currently using right now is
https://docs.google.com/spreadsheets/d/1iDyk0NHbfqSFqF3ZSijLQDjb4hENuRToxRPfVwbqweg/edit?usp=sharing
And you can see the sections for dividend yield, dividend yield per share, and dividend income per year are all not functioning properly. Any help would be appreciated.
Hi,
I’m unable to access your spreadsheet. If you’re just getting #VALUE for the BCE stock, then something goofy is happening. Did you download my spreadsheet example and revise it?
Tawcan, Great spreadsheet!
Do you think if we download/convert this from Google sheets to Excel that would resolve or get around the Google import limit?
Thank you. I’m not sure, I don’t think the Google functions and ImportXML would work if you convert everything to Excel sheet. I could be wrong though as I haven’t looked into this in detail.
Looks like =split is an invalid function in Excel.
Hey! I was just wondering, where can I download your template?
If you scroll to the end of the post there’s a link to download the template.
Hi,
Can you make it work with more currencies like Sweden, france, germany etc?
/Thanks
You can modify the sheet by populating more currencies in column C. Then adding different exchange rates after row 32. 🙂
Hello!
First of all, thank you for this information, it is really useful! I am from Canada as well!
I have been trying to get the dividend information from Yahoo Finance with the formulas that you have provided but I keep getting error. Could you confirm that the formulas have not changed?
Cheers,
Formula is still the same. The problem has to do with Yahoo/Google.
My spreadsheet stopped working. When you say the problem has to do with Yahoo/Google, what do you mean? Thanks.
It’s when the ImportXML funtion starts telling you there’s an import error or fetching error.
Hey! Very useful information, and thanks for the share!
I saw in your previous post that you had issues getting the XPATH accepted in the actual formula. If you did wish to integrate it, it’s just a matter of replacing the double quotes with single quotes in the XPATH, and then quoting that back into the formula.
ie:
//*[@id=’quote-summary’]/div[2]/table/tbody/tr[6]/td[2]
into
=split(IMPORTXML(concatenate(“https://finance.yahoo.com/quote/”,D5),”//*[@id=’quote-summary’]/div[2]/table/tbody/tr[6]/td[2]”),”()”)
Cheers, and thanks again
I noticed the dividend value is pulling from Yahoo anymore – any ideas how to resolve this?
scratch that Bob- I saw your note in your Portfolio sheet that you’re investigating. I’ll post here if I figure it out.
Excellent spreadsheet. Quick question, when playing around I noticed it doesn’t pull dividend yield for some ETFs (ex: ITOT), how can that be changed? Additionally, for stocks that don’t have a dividend it returns a value of “N/A” is there a way to make this return a “0”? Thanks a bunch! Brian
I should have provide an example for my second question. Please try “PYPL”. Thank you.
You can use an nested if statement so if the dividend returns N/A, the if statement populates 0 instead.
Hi Tawcan,
I can’t seem to work the nested if statement out for the whole function.
Is it possible to send through an example 🙂
Cheers,
The current spreadsheet shouldn’t need nested if statements.
Thanks for the comments I have tried both, some work some don’t. Thanks again I will keep looking.
HI Tawcan,
Thanks for the spreadhseet, it is wonderful, If I can get the dividends to download I will send money for sure. All I get is “loading” or “N/A” what can I do. i have tried everything, I have re copied the formula, re typed it, hard coded the stock code. I have US and Cdn stocks. Some stocks show up and others just say loading etc. I have 40 stocks that I track and I have added some new columns to your spreadhseet. The funny thing is it works for 2 days then stopped and has not worked for about 3 days now. Is this a google thing and I have to type them in for now or what could I be doing wrong? Happy to send it to you. Thank you in advance
Hi Ian,
As stated in the spreadsheet, the “loading” or “N/A” has to do with the ImportXML function and Google. Not much I can do. You can try changing http to https or vice versa to see if this addresses the issue.
Hi Ian:
Late reply, but after trying a number of different sites to capture my portfolios I have found they all have a problem with the dividend capture no matter where they get it from. This one from Tawcan seems a lot less troublesome then others that I have tried and it now has become my main portfolio tracker. It just is slow loading sometimes, other times the information is there when I open the spreadsheet. It just may be a factor of how much the requested site is being used. Right now, Nov 18, 2019, 12 noon in CA when I open the spreadsheet about 20% are filled in and the rest are either NA or loading. Evenually they all get filled in. But if you need the information ASAP just go to the NASDEQ website for the info on dividends. I am retired. so I have a different outlook on how I use the portfolio trackers including modifying and adding some other functions to the Tawcan spreadsheet to give me more of the information I like to view. Be happy to share with you.
Hi Bob:
Like your spreadsheet as it is fairly non-complex (Don’t want to use the word simple as it works). Since I am retired I depend on my dividend payments and do track them. I have one portfolio where I use the dividends for current expenses and another portfolio I use for those stocks I wish to reinvest the dividends. Kind of like a safety valve.
What would be nice would be a transaction page that would fill in the main portfolio page as I entered each transaction. I could figure out how to differentiate between dividends that I use and those I reinvest.
Anything in the works like this?
BTW, I have used another spreadsheet, but it became very complex with items I did not need and my idea is to always KISS.
Jim
Hmm that’s an interesting idea, something to consider for sure. Thanks for the suggestion, I may look into this later.
Same here!
Any tips on getting the fetching to be more consistent? It has gotten to the point that if i leave my spreadsheet open in a tab maybe once a week it will actually briefly load the Imported Dividend/Yield columns, most of the time it actually loads a few reads #N/A for the rest so the totals and chart wont compute.
Unfortunately this is all due to Google and the ImportXML function. Not a whole lot I can control. I’m looking at more reliable ways. I suppose in the mean time you’d need to manually enter the dividend amounts. 🙁
Hi TAWCAN,
FYI, my problem is solved (for now)! I just went back to your updated google sheet, copied your paths for both stocks and etfs over mines and everything works. I don’t know what broke in my spreadsheet but I will remember to do the same if the dividends stop populating again.
I was lucky when I did it on my March 19 comment. Got it to work only in the middle of a sleepless night… ☹ Fetching never works during the day…
works perfectly!
Hi Mary, Tawcan. I was playing around with the numbers at the end of the Xpath thinking if I could get the Yield% for Etfs then the Yield column could be a Yield%*Price formula to get the Yield (this would be the right math?). Of course while I vaguely understand the concept of what the import formula Tawcan gave us does randomly changing numbers to get it to do something else didnt work 🙂 Even if it did I’d then want to separate my Etfs out so and add the totals back in
Hi Michael & Mary,
I haven’t forgot about you two about this. I’ll have to take a closer look at the Xpath for ETFs and see what happens. Unfortunately, I’m not accessible to a computer right now so a bit limited on my ability to check. Stay tuned please. 🙂
Thank you and no worries Tawcan. So happy I found your spreadsheet!
Hi Mary & Michael,
I have confirmed that Xpath for ETFs is below:
//*[@id=”quote-summary”]/div[2]/table/tbody/tr[4]/td[2]
What you may need to do in the spreadsheet are:
1. Make sure the for the cell entry is % not $ as Yaoo Finance only provides % yield for ETFs
2. Move the query in the yield % column
I have updated the spreadsheet to provide an example of ETF.
Same here, thank you!
As indicated by Michael, I’m getting the beta (3y monthly) of 0.92 in DIV/SH, nothing in Yield %
Thank you again for your help. Will wait to see if you find something out for ETFs dividends
Your guide has been a great help in building my own spreadsheet for tracking our dividend portfolio. Unfortunately I am having the same problem as Mary in the above comment. The Xpath for equities seems to propagate the Beta for an ETF but if you use the Xpath you gave for ETFS you get: “Error Imported Xml content can not be parsed”. I tried messing about changing values in the equity Xpath to try and get to the yield data on Etfs but needless to say was mucking about with no idea. I’m not even sure where Dividend Rate might be listed for Etfs on Yahoo Finance as the summary page only lists Yield % and not Rate. I was thinking to try and get it to pull the Yield so I could then do a formula for etfs to back figure the Rate but then it seems like I would almost need to do Etfs separately and I couldn’t figure out how to get the Yield to pull anyway
Looks like Yahoo Fianace onyl gives yield percentage for ETFs. I’ll have to take a closer look at pulling ETF data on a later date.
Love your spreadsheet, many thanks!!!
I can’t get the dividend info for ETFs. I copied and pasted your link for ETFs from your notes under the cell B43 and referenced DIV/SH to this cell instead but it doesn’t work. If I leave your regular link, I get the DIV/SH for what looks like monthly dividends and I don’t get the Yield. (Eg: REM, SPYD.)
For XEI.TO, I get the yearly dividend but not the yield.
Can you help with this?
SPYD, REM, and XEI.TO only have yield percentage on Yahoo Fianace and not the dividend amount. What are you getting for XEI.TO?
Great spreadsheet. Hope you don’t mind me using it to track my divs and then post the results on our website. Of course we’ll link the sheet to your blog. Cheers from Victoria, BC
Sure as long as you link back to my blog. 🙂
Thanks for the help.
I’m trying to figure out how to download price data on the following stock on the TSE: National Bank preferred share class S
On Yahoo finance I use NA-PS.TO
On google sheets it comes back with #N/A.
Any ideas on what the format I should use ?
I think the right symbol would be TSE:NA.PR.S but for some reason Google Finance does not have this ticker info.
You might need to manually enter the price info for now.
TSE:NA-S
Hi Tawcan
I don’t know too much about Excel and I wanted to ask if you have a template which can be downloaded.
Thank you
The template is at the end of the post for downloading.
I love your template and use it all the time!! Thank you so much.
Did you notice that the price function is no longer working for Canadian stocks? For example GoogleFinance(RY.TO,”PRICE”) now returns #N/A. Does anyone know how to fix this issue?
I noticed that earlier today. You can also try using TSE:RY instead of RY.TO in the formula.
Hi.
Thanks for the spreadsheet. I primarily use the function to pick up dividend and yield info from XML parsing from Yahoo Finance. It works great for my stocks. Yet, it always returns N/A for stocks that pay out dividend “monthly”. I will give you some examples, tickers such as “DMO”, “ETJ”, “GOF”, and “IGD”. Can’t figure out why so. Will you take a look at that? Thanks.
Hi Vincent,
This is because for tickers like DMO and ETJ, there’s no dividend info on Yahoo Page:
https://finance.yahoo.com/quote/DMO?p=DMO
https://finance.yahoo.com/quote/ETJ?p=ETJ
https://finance.yahoo.com/quote/GOF?p=GOF
https://finance.yahoo.com/quote/IGD?p=IGD
So the formula returns N/A. Not much I can do when the source page does not have valid info.
Hi Bob,
Great insight and information. I came across your page as I was searching for a dividend portfolio template to reference in excel. Would you happen to have a google spreadsheet to share?
Hi,
At end of the article you can download the Google spreadsheet template.
Hello Tawcan, have you determined how to obtain the DGR?
Regards
Hi Kimm,
There are ways to do that but they all involve some sort of manual work. There are websites that have DGR numbers you can pull from but most of these sites require monthly payments.
Hi, This has been very helpful for me.
Can you shed some light on how to alter the XPath so that I can collect a different data point?
For example I would like to get the Payout Ratio value from the Statistics tab of a stock quote. I see your XPath is pointing to:
//*[@id=”quote-summary”]/div[2]/table/tbody/tr[6]/td[2]
how could you modify this Xpath to collect Payout ratio from the statistics tab of a quote?
For example…. Verizon (VZ) statistics are found here: https://finance.yahoo.com/quote/VZ/key-statistics?p=VZ
I see the payout ratio under Dividiends & Splits. How would I identify the correct Xpath for that data point?
The easiest way is to use FireFox and use the Web Developer tool and inspect the code of the page. Once you find the code, then right click Copy -> XPath, then you need to clean up the XPath a bit.
For example, the payout ratio entire XPath would be:
/html/body/div[1]/div/div/div[1]/div/div[3]/div[1]/div/div[1]/div/div/section/div[2]/div[2]/div/div[3]/table/tbody/tr[6]/td[2]
But you need to clean it up. You also have to point the concatenate formula to the correct URL.
It’s a bit of trial and error. 🙂
Hi TAWCAN
I just wanted to say thank you for posting a method for importing dividend amounts and yields . It is really helpful and very much appreciated .
Best
Hi
My sheet worked well for a few days but now some dividend data is incorrect and others are OK with the same formula. AFL returns 43 104,00 for dividend (actualy it is 1.04$) and the yeald is OK at 2.33%.
Yahoo changed some of the data format?
Thank you.
Hi Jean,
Hmm I don’t see that. When I plug in AFL in the dividend spreadsheet the query returned 1.04 and 2.33%. Exactly what showed up on the Yahoo Finance page.
https://finance.yahoo.com/quote/AFL?p=AFL
Did you change the XPath somehow?
didn’t change xpath – i think i figured out why I’m pulling weird numbers for some of my holdings. it looks like XPATH is pulling the correct div info for individual stocks, but for ETFs the 6th field is 3y beta. (XLF pulling 0.92)
thanks again!
Hi Bob,
Thanks for all the work you’ve put into this. Very glad I found your website through RFD.
Could you help point me in the right direction? I’m having trouble pulling the div/share data from yahoo finance, it appears the xpath is pointing sometimes to other data such as 3y beta.
not sure if i’ve entered something wrong, part of me suspects it’s because the quote pages have different fields depending on the ticker symbol,
Wayne
Did you modify the XPath in the original spreadsheet? The path should be correct and you shouldn’t be getting 3y beta.
Hey Bob,
Great info on your website. My question is this… I am currently using your spreadsheet to rebalance my ETFs portfolio and a couple of my ETFs(IEFA, IEMG) are now not being updated by Google finance. I just get an “N/A” in the cells that track name and current price. I have tried adding the exchange prefix for the ETFs and it still does not work. Without that data I am not able to rebalance. Any workaround?
Thanks
Ian
Looks like Googlefinance function is having some hiccups the last few days. TSE stocks don’t seem to return any price info. Hopefully Google will get there stuff together soon and fix this.
Thank you for the quick response. I have marked the stock US in this case and the exchange remains off. Maybe some more into might help solve my problem.
I use TD Waterhouse. When I input my average cost per stock, TD Waterhouse uses CAD, which I have inputted into the spreadsheet under cost/share. I used the book value from TD Waterhouse, which also appears to be in CAD and inputted that into ‘cost basis’
As an example, I inputted GOOG into the spreadsheet. TD Waterhouse has my average cost/share as $1,248 CAD and the cost per share as of Friday’s close was $1,111.90, hence the spreadsheet says I am down but given the exchange I am up more than 10%., which is not reflected on the spreadsheet. The cost basis or book value that I added to the table was in CAD, taken from TD Waterhouse. I think I am missing something that is straight forward but can’t figure it out. Any more help would be great.
Hi Aaron,
I think the problem is that you put average cost/share with CAD and the price is being pulled as USD. What you need to do is cost/share in USD for the spreadsheet to calculate the correct gain. Hope this helps.
Thank you very much for this great spreadsheet. I follow your site closely. I have been inputting my portfolio into your spreadsheet and ran into a bit of a problem when it came to adding my USA stocks. For example, when I added BLK, I used USA currency (left side of table), added my book value (taken from brokerage) under the cost basis , which came up with the correct cost/share in USA dollars, however the profit and market value numbers are incorrect. Somewhere along the line it must not be reading the currency exchange properly, as when I add my Canadian stocks with the same method, my profit or loss is bang on to what my TD Waterhouse account shows. Is there a manual conversion that I need to complete? Any help would be great. Thank again for this great spreadsheet.
Is the currency conversion not working properly as expected? You need to make sure that you mark whether stocks are CAN or US.
This is a great walkthrough. A tip: for Canadian stocks, one can go “TSE:[TICKER]”.
Question: is there any way to automate calculating the DRIP dividends? Especially a DRIP that gives a discount? I’ve setup an Excel sheet but I have to manually update it.
Unfortunately there’s no automatic way to calculate the DRIP dividends, especially when a company gives a discount for DRIP.
Hi Tawcan, thanks for the walkthrough of your chart, I was looking for a way to do the yield in a separate column, and lucked out when your site came up, very much appreciated!
Glad to have helped Bill.
Hi Tawcan,
I had a bunch of people asking me about the “Loading…” and “N/A” issues as well. Definitely very annoying thing to happen. One of the ways that seems to sometimes help is to change the http to https and then change it back when that stops working. It has something to do with the cache not clearing on Google Sheets.
However, I recently updated my dividend investing spreadsheet to include a different method that works even better. It uses the scripting language that Google has built into Sheets. There’s more information about how I did that on my site: http://www.twoinvesting.com/2017/10/more-details-about-the-new-dividend-stock-portfolio-spreadsheet/
Scott
Hi Tawcan
When I load my spreadsheet (which was originally an Excel spreadsheet) and converted it to a Google sheet, I replaced my macro’s that were yahoo based (no longer free) with your formulas and queries for both dividend and dividend yield. The Import XML functions seem to work as when I open my sheet all of the 38 stocks that I own show a “… loading” for both dividend and dividend yield for upwards of 20-30 minutes before they are all displayed. When I downloaded you sample sheet, those functions load immediately. My question is, could you potentially tell me what I should be looking for that might be causing the dividend and dividend yield to load so slowly. Your comments would be appreciated. Your site is great. Thanks for allowing others to benefit from your knowledge.
Hi Mike_T,
That’s odd, Google seems to have limited the Import XML function a bit due to security reasons so you might get loading or N/A from time to time. I’ve been trying to figure out how to get past this but haven’t found a solution. 🙁
Hi Tawcan,
Thanks for sharing your google sheets. I have a very basic question. How do you purchase your own stocks without a financial advisor? What brokerage do you use and how do you avoid the fees that play into buying and selling or MERs? Thank You
We use TD Waterhouse and Questrade which allow us to trade stocks on our own.
I had been using MarketXLS and it’s great.
Thank you for your tips and shares. Is there any way to pull sector through any function either google or yahoo instead of manual entry?
Good question, I’ll have to do some more investigations on whether this is possible or not.
Thank you for sharing the Google sheet instructions. I hope to try this set-up very soon. In the meantime, I shared the link to your instructions with the Facebook group called Dividend Growth Investing. There are over 5,000 members in the group, with the vast majority in the U.S.
You’re welcome, hopefully the guide is useful for you.
Thanks for sharing this Tawcan 🙂
Serge,
Hi Tawcan,
I have discovered your very interesting blog yesterday as well as your dividend portfolio template which meet my own rquirements. I am just a novice in googlesheets and am sure to learn a lot thanks to your expertise.
When I click on the titles in the panels on the right part of your article, such as “Monthly dividend stocks” for example, I am always redirected to an Amazon advertisement page and can’t read anything more. How could I overcome this please ?
Congratulations for your fantastic job !
Hi Serge,
Thank you. You probably clicked on the ad on the page. Just go back in your browser and you should be able to see the rest of the page. 🙂
Hi Jack,
I have noticed that a bit but I typically don’t use Google Finance for evaluating things like EPS. I typically use Morningstar when it comes to stock evaluation. Yes it’s quite concerning that the discrepancy is so large. Without looking into it further is it possible that the discrepancy is due to GAPP vs. non-GAPP?
Hi Tawcan,
When I evaluating a stock prior to buying, I almost always cross-reference some of the values against the actual financial reports.
Speaking of the evaluation and analysis process, it will be great if you can write a post and share some of your experiences and approaches as well, I am curious to learn it from an expert like you.
Cheers,
Jack
Hi Jack,
Makes sense. Cross reference is always good. Good point on evaluation and analysis process. I’ll see what I can put together.
Hi Tawcan,
Not meant to comment twice here, but I noticed some discrepancies in the information provided by Google Finance, and I hope you can shed some light. Some of the information showed on Google Finance deviates quiet a bit from other sources and the official financial reports.
For example, Shaw Communication (SJR.B). The EPS shown on Google Finance is “1.16”, which is doesn’t match anything of the EPS stated on the financial reports, either the Basic or Diluted. TMX Money, which is the alternative source I use for verifying information, is shown the EPS is “2.78”.
I wonder how Google Finance and other sites calculate the EPS, as well as other attributes.
This is quiet concerning since the discrepancy is huge, and could potential impact many of our investment decisions.
The spreadsheet looks very clean, thanks for sharing it! I love excel and I love investing and I need to figure out how to combine the two together in the coming years. I just might use your template because I don’t think I’m that skilled at tracking information.
Thanks Finance Solver. Feel free to use my template.
Request to readers: Would you please share your spreadsheets? It would be great to see the variations people come up with.
I’d love to see other people’s spreadsheets too.
Hi Tawcan,
Great instruction.
However, I still couldn’t get the dividend/yield formula to work:
=split(ImportXML(concatenate(“http://finance.google.com/finance?q=”,D2), “//td[@data-snapfield=’latest_dividend-dividend_yield’]/following-sibling::*”),”/”)
It always show up as “Error Could not fetch url: http://finance.google.com/finance?q=TSE:TD“.
Anyways, I’ll try other work arounds.
Hi Jack,
Unfortunately Google seems to have implemented some sort of security protection to limit ImportXML function. I’ve found that if you switch back and forth between http and https the dividend/yield info would show up. Other method (not ideal), is to simply enter the dividend/yield info manually.
I also receive the “could not fetch URL” error, even when I switch between https and http. Is there another source to get the annual dividend per share?
Tawcan,
Thanks for sharing! As the post above mentioned – I am actually using Scott’s at twoinvesting as well, but I also have my own in which I track some additional items I like to track. Your’s did include some items for me to make mine better as well! My spreadsheet has like 10 tabs on it though. Love the simplicity.
-TDM
Thanks TDM.
Thanks for sharing Tawcan. Scott over at http://www.twoinvesting.com/ has been building similar spreadsheets for a while. I’m gonna take the best of yours and his and make a master version for my use. Thanks
Hi Investment Hunting,
Scott has built great spreadsheets. 🙂
Thank you so very much for this. I really, really needed this. I looked at other similar posts and tutorials, but they were not clear to me. I have yet to try your instructions, but I’m eager to do so. Question: Can I set up 2 (or more) spreadsheets? One for my registered account, and one for my non-registered account?
Request: Since you’re an Excel nerd, can you provide instructions on how to custom sort the Dividend All-Stars Excel spreadsheet, or the CCC lists (David Fish lists), I mean, creating a sort based on 4-5 criteria. Example: (1) dividend streak >/=8 years, (2) dividend yield >2.8%, (3) 1-Yr, 3-Yr, and 5-Yr DGR >/=5.0% and (4) by the latest dividend increase >/=5.0%.
Thank you.
Hi Helen,
Glad to have helped. You certainly can set up 2 or more spreadsheets if you want. The template I shared have all the accounts in one sheet for easy tracking purposes.
Rather than using Sort you can select all the data and Filter them. The trick is to create special rules as you indicated.
Great post! I haven’t used ImportXML myself. Learning XPath doesn’t look like too much fun.
I’m busy with research to revisit the use of ImportHTML for pulling in data from financial websites. See http://divgro.blogspot.com/2014/06/tracking-your-dgi-portfolio.html
Thanks for sharing!
ImportHTML is similar idea as ImportXML, you’re just importing from different sources. 🙂
I’ve built nearly the exact same spreadsheet for my own portfolio Tawacan. I track a few different things, such as dividend growth rate, but it’s pretty much the same spreadsheet!
Great minds think alike I guess? Cheers!
Great minds do think alike.
How do you get the dividend growth rate? Is that something you enter manually? I’m trying to figure out a way to have DGR calculated automatically.
will it add the dividend to the total amount of shares automatically if the drip is on ? or does it do it when you add it to the dividend income page ? also when you add another year to the dividend income page how is that done ?
Hi Alex,
No it does not add the dividend to the total amount of shares automatically if DRIP is on. It’s not possible to do because I don’t know if you are enrolled in full DRIP or synthetic DRIP. Second, I don’t know what price the DRIP shares were purchased since sometimes companies offer DRIP discount. You’d need to add this DRIP information manually to keep track of your cost basis.
To add another year to the dividend income, I simply create a new sheet, enter all the stocks, and enter the dividends received accordingly. Hope this helps.
Really appreciate this Tawcan. At the moment we have a fairly basic Excel sheet for tracking our (Aussie) dividends. Perhaps we could use yours, or really go to down on adding more information to ours..
Tristan
Feel free to use my template or add parts of mine into your existing one. This template I just shared has evolved over time. The original template was pretty simple too.
Tawcan, thank you for the tutorial. Having this kind of spreadsheet in detail makes it easy to track dividend portfolio.
Glad to have helped you Jayson.
I like this for a “snapshot in time” look at the portfolio.
I’d like to see something that shows how the portfolio value and income changes over time.
That may not be easy though.
Hi Fred,
I wouldn’t call it a snapshot in time as this provides real time portfolio information. 🙂
If you want to see how the portfolio value and income changes over time, you can simply create another sheet and tabulate the values at specific time and generate a chart to show the results. Hope this helps.
Neat Spreadsheet.
Quick question – why do you track Yield on Cost (YoC)?
Curiosity?
ie: you don’t use that for investment decisions? ie: decide not to sell an investment that has a YoC of 10% because the replacement only has a yield of 4%?
Hi Matt,
Good question! I track YOC to give me an idea how much the portfolio is yielding. It’s not used for investment decisions, it’s just for tracking purposes.
Ok, it’s ok for curiosity sakes I suppose – I just see so many people use it incorrectly.
Won’t ‘yield’ give you what your portfolio is yielding?
Correct, Yield would give me what my market value portfolio is yielding.
YOC would give me what I’m getting based on my cost basis. It’s just a number I like to see. It shows how important & powerful dividend growth is.