
“Wow, this stock is really expensive at $500 per share. I ain’t going to buy this expensive stock.”
“At $150, I’m not touching that stock with a ten-foot pole.”
“I only look at stocks at $40 or less, because anything above that price is just too expensive.”
I don’t know about you but I always cringe when I hear statements similar to the ones above. Making a statement on whether a stock is expensive or not purely on share price alone is like judging a book by its cover.
You just can’t do that!
Let me say it again… I don’t believe you can assess whether a stock is expensive or not by simply looking at the share price. We need to examine deeper than just looking at the dollar amount.
How to determine if a stock is expensive or not? Let’s find out shall we?
Price to Earnings Ratio (PE ratio)
The price-to-earnings ratio, PE ratio, the price multiple, or sometimes the earnings multiple, is one of the metrics used to determine the relative value of a company’s share price to its earnings. As the name indicates, the ratio is determined by dividing the share price by the company’s earnings per share.
The PE ratio allows investors to have an apples-to-apples comparison between the different stocks. It is also a great metric to use to compare the historical performance of a company.
A few investment books I’ve read used the PE ratio as an indicator of how many years it’d take to earn back your initial investment based on the company’s ongoing profits, assuming the company’s earnings stop growing. Put in easier terms, a PE ratio of 10 means that if you buy a company’s shares, it would take 10 years for you to earn back your initial investment amount (hence for buying a stock with a really low PE ratio).
A stock with a PE ratio of 20 or lower is typically considered “cheap.” But what is the right PE ratio will be highly dependent on the sector. For example, the Big Five Canadian Banks typically have an average PE ratio of around 10, while companies in the consumer staples sector like Costco, Walmart, Metro, Coca-Cola, and Procter & Gamble usually have an average PE ratio of around 20 or higher.
Consumer staples typically have a higher PE ratio because of the stable nature of the business. When more investors want to buy the stock, it tends to have a higher PE ratio. This is one of the many reasons why high tech stocks usually have a very high PE ratio.
Therefore, a low or high PE ratio doesn’t immediately tell you whether a stock is expensive or not. It is best to compare the PE ratio to its peers in the same sector.
If you’re evaluating a stock and deciding whether to purchase or not based on the PE ratio alone, it is a good idea to look at the historical PE ratio as well.
Take TD for example. At the time of writing, TD’s share price is at $93.15. At $9.47 earnings per share, this means TD has a PE ratio of 9.84. How does it compare to its peers?
Note: I wrote the article a while ago TD’s price has changed a lot since. But the logic still hold in this case.
- Royal Bank: 12.56
- Bank of Montreal: 6.76
- Bank of Nova Scotia: 9.22
- CIBC: 9.35
- National Bank: 10.50
Compared to its peers, based on TD’s PE ratio of 9.84, I’d say that TD’s share price is about right. It’s neither trading at a discount nor at a premium.
What about TD’s historical PE ratio?
Per Dividend Growth Investing & Retirement’s Canadian Dividend All-Star list, I was able to find the following historical PE ratio information for TD:
- 5 years average PE ratio: 10.9
- 10 years average PE ratio: 11.6
- Highest PE ratio in the past 10 years: 14.1
- Lowest PE ratio in the past 10 years: 7.6
Taking one step further, below is TD’s PE ratio per Macrotrends from 2010 to now.
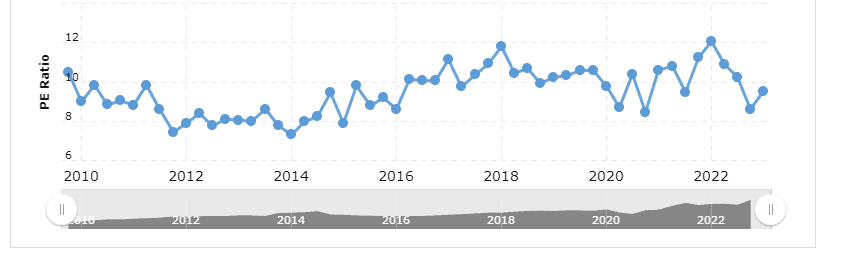
Again, based on the current PE ratio of 9.84 for TD, I’d say that the share price is at a fair value.
So, for some investors to look at TD’s share price of $93.15 and call it expensive, I would say this is absolutely wrong. Based on TD’s PE ratio, I would say the share price is neither expensive nor cheap, just about right.
What about BlackRock Inc, the parent company of iShares ETFs? At $729.15 USD per share (972.56 CAD), some investors may have a sticker shock and immediately label BlackRock stock as ridiculously expensive.
On the surface, at a PE ratio of 21.47, BlackRock certainly looks like it is a bit on the expensive side. What about comparing it to its peers?
Per Companies Market Cap, below are companies similar to BlackRock:
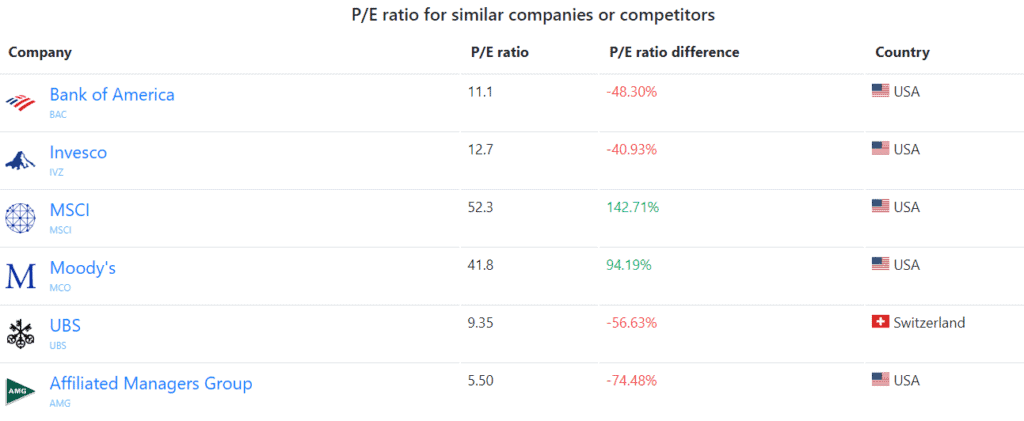
Unfortunately, this data doesn’t provide anything conclusive.
Wellington Management, Edward Jones, Charles Schwab, Morgan Stanley, State Street, and Vanguard come to mind as BlackRock’s competitors. Not all of them are traded publicly, unfortunately.
- Morgan Stanley: 23.06
- State Street: 13.02
Given the lack of PE ratio data from BlackRock’s peers, it’s rather difficult to determine whether BlackRock’s share price is expensive or not.
Instead of comparing it to its peers, it is better to look at BlackRock’s historical PE ratio. Pulling data from Macrotrends again:
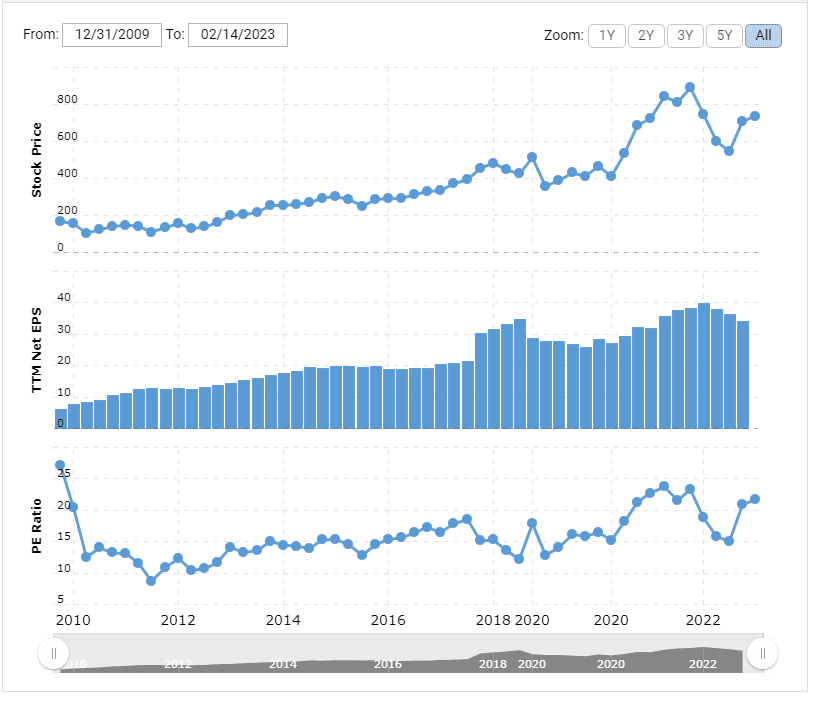
Based on the historical PE ratio only, I’d say that BlackRock is trading at a slight premium compared to its historical PE ratio.
Finally, let’s take a look at Apple.
At $153.20 USD per share, Apple has a PE ratio of 26.03, much higher than the commonly acceptable PE ratio of 20. However, compared to its peers like Microsoft, Amazon, Alphabet, Netflix, and HP, Apple’s PE ratio appears on the lower end of the spectrum.
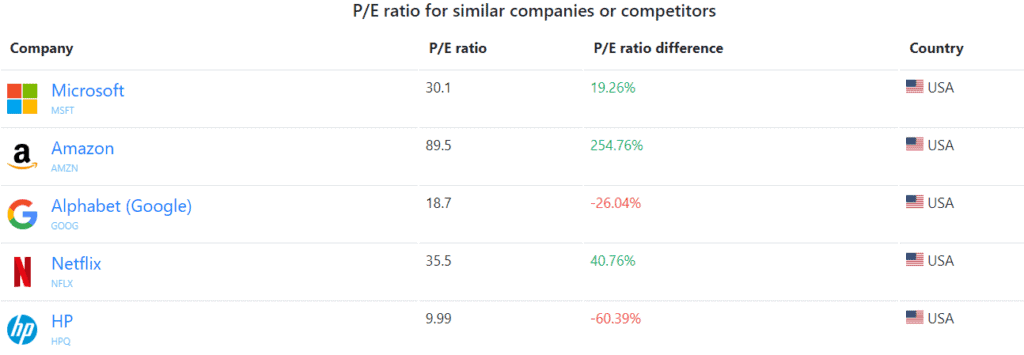
Since Apple generates revenues from a mix of hardware and software, it is hard to find a similar company as Apple for an apples-to-apples comparison (ha!). Therefore, the historical PE ratio is a better indicator.
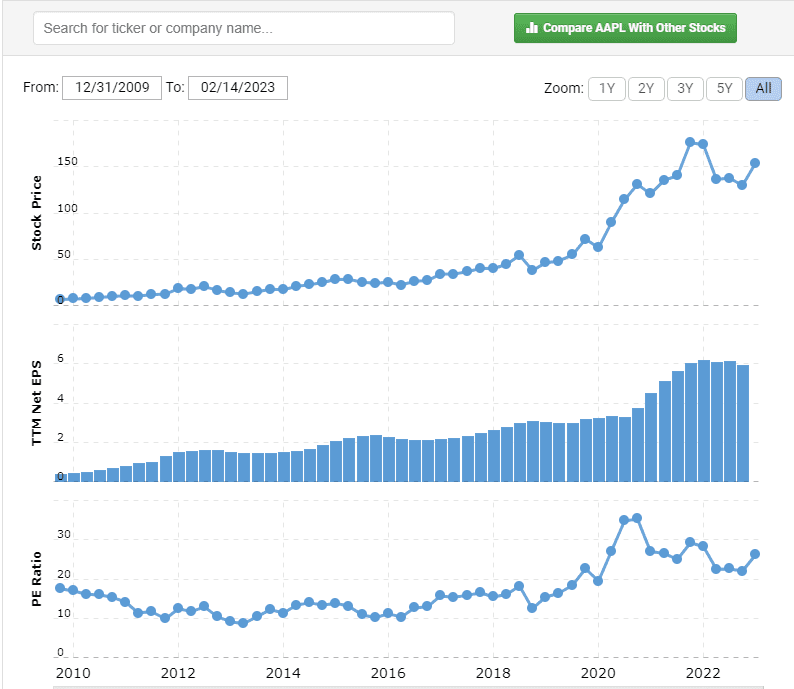
Based on the chart above, I’d conclude that Apple is trading at a slight premium compared to its historical PE ratio.
One important thing to remember though… Often “hot stocks” and tech stocks do trade at a higher premium because of the higher future growth potentials (For example, Constellation Software would fall into this and perhaps Tesla pre-stock split).
So if you decide to invest in a hot stock like Apple, don’t quibble over eighths and quarters, and definitely use other valuation metrics to determine whether to invest in it or not. Reading its quarterly and annual reports is also a great idea.
Price/Earnings-to-Growth Ratio (PEG Ratio)
As much as I like using the PE ratio for stock valuation, one of my favourite go-to metrics is the Price/Earnings-to-Growth Ratio, or the PEG ratio for short.
As the name suggests, the PEG ratio is a stock’s PE ratio divided by the estimated growth rate, typically in the next five years. The reason I like PEG ratio is that it takes the future growth rate in earnings into consideration.
Essentially, the lower the PEG ratio, the more attractive a stock is.
Take Company A and Company B for example.
Company A
- Share price of $850
- PE ratio of 20
- PEG ratio of 0.5
Company B
- Share price of $5
- PE ratio of 20
- PEG ratio of 3
Is Company A really expensive? If you base your valuation on share price only, then yes, $850 per share is a lot more expensive than $5 a share. But at a PE ratio of 20, both companies have similar values.
Which one should you consider purchasing? Well, based on a lower PEG ratio, I’d say that Company A is a better buy. I would ignore the $850 per share price tag and buy Company A all day long based on the lower PEG ratio. Of course, we probably need to do additional assessments on Company A before we buy the stock…
More assessments needed
I have just provided two valuation ratios that investors can use to determine whether a stock is expensive or not. But these aren’t the only metrics that can be used. Here are some additional metrics you may want to check out before hitting the buy button:
- Price to Book Ratio
- Return on equity
- Free cash flow
- Earning per share growth rate
- Debt-to-Equity Ratio
- Dividend growth streak
- Dividend growth rate (i.e. 5 years, 10 years, etc)
I certainly use these metrics for stock valuation. If you aren’t familiar with some of these, please refer to my good friend Google. 🙂
Let’s not forget, having a dividend scorecard is also extremely helpful.
And often, it’s not just about stock valuation, it’s about thinking like an owner and being an owner.
Summary
I hope I have demonstrated that you can’t just conclude whether a stock is expensive or not based on share price alone. And I really hope readers come to the realization that buying stocks based on a set price (like $40 or below share price) is not a good idea, because you will end up missing out on many high quality stocks.
Rather than putting a strong emphasis on share price, focus on the fundamentals!
I think an important metric is the E10 or CAPE. As well as the stochastic. These 2 have never failed me.
COST’ s PE Ratio Range Over the Past 10 Years
Min: 22.81 Med: 30.43 Max: 49.49
Current: 38.77
Yup, that’s a good metric to look at as well. 🙂
Another great article.
I still can’t figure out Costco with high PE of 40 and high PEG over 4.
Also cash from membership fees are fixed and not growing. These indicate Costco is way overpriced yet people still buy it.
What factor did you use to purchase more COST?
It’s a stable business with loyal customers lol?
Unfortunately, some financial metrics don’t explain why an investment is a good investment. 🙂
As mentioned, some sectors will have higher PE ratio than other sectors.
I also like to look at revenue/employee. It is an interesting number to look at. Some smaller companies can have very high revenues per employee indicating high productivity while larger companies may have much lower revenue/employee in the same category. Combined with the actual number of employees (and often a commitment to pensions/health care/etc.) I think it is a metric overlooked. Comparing a company with 30,000 employees vs one with 200 is a challenge. What are your thoughts?
Revenue/employee is an interesting number to look but that doesn’t give a true reflection of how well a company does IMO. Startup/smaller companies tend of have a higher revenues per employee but that typically doesn’t mean higher productivity… can just mean that more employees are working overtime. 🙂
Good point!
I would like to be aware that PE sometimes are not good metric on certain companies. A good example is Amazon which trades at a very high PE, but the buisness’s PE is out of whack because they tend to reinvest a lot into the buisness, even Jeff Bezos himself said to evaluate them more on their operating cash flows opposed to earnings. The p/OCF is a better metric for them.
*make readers aware…
That’s a very good point. Thanks Fil.
Hi Bob, this is very helpful info. Also wondering what website you accessed for historical P/E ratios?
Thanks
Hi Mark,
Thank you. I have linked the website(s) in the article. 🙂
As of today (2023-06-26), Costco Wholesale’s current stock price is $523.42. Costco Wholesale’s E10 for the quarter that ended in May. 2023 was $9.41. Costco Wholesale’s Shiller PE Ratio of today is 55.62.
During the past 13 years, the highest Shiller PE Ratio of Costco Wholesale was 76.13. The lowest was 33.49. And the median was 42.53. Correction here is E10 for costco.