
One of the best things you can do, as an investor, is to read a company’s annual and quarterly reports. Reading these reports is especially important when you are looking to invest in a new company that you may not be familiar with. It can be quite intimidating to read an annual or quarterly report though, because there is a lot of technical and investing jargon and a lot of numbers that can easily cause confusion. After a quick Google search on how to read annual reports and how to read quarterly reports, I found most of the top search results to be very generic and not all that helpful. So, I thought I could write an article describing how I usually read annual and quarterly reports to help me determine whether to invest in a company or not; hopefully readers will find this helpful. If you already own a company’s stock, it also makes sense to regularly read the annual and quarterly reports to understand how the company is doing.
For this exercise, I will take a closer look at two companies’ latest annual and quarterly reports. The two companies I decided to take a closer look at are Royal Bank and Tesla. One pays steady dividends and is one of the biggest companies in Canada while the other doesn’t pay dividends, is a US company in an extremely fast growth mode, and is in the news a lot.
Please note, due to the nature of annual and quarterly reports, this is going to be a MASSIVE post. You may want to read this article a few times, or take a break here and there if the information gets too overwhelming.
Note 1: I don’t have an MBA and never received formal training in how to read annual and quarterly reports. This post is simply a self-explanatory guide of how I typically read these reports for my own analysis.
Note 2: I am not a certified financial advisor. This analysis is purely an exercise, it is not a buy or sell recommendation. Please do your due diligence before any purchases.
How to find annual and quarterly reports
In case you are wondering, you can find annual and quarterly reports on the company’s investor relations website. You can either search for the link on a search engine like Google, or you typically can find the link at the bottom of a company’s website. (In Tesla’s case, such link isn’t available on their website).

For Royal Bank, the investor relations website is here.
For Tesla, the investor relations website is here.
Once you are on the investor relations site, you usually can find the annual and quarterly reports under the menu, typically under Financials & Accounting, Financial Information, Financial Reports, Quarterly Information, Annual Meetings and Reports, or something with similar wording.
How to read annual reports
When I start to investigate a company and determining whether I should invest in its stock or not, I typically start with the annual reports. It is a good idea to read through the latest annual report to get a good understanding of the company and how it has performed in the past corporate year. Lately, I noticed that some Canadian companies started putting out interactive annual reports on their website, which I think are quite neat. However, I generally prefer reading annual reports in PDF format that companies send out to their shareholders. One important thing to note is that no two annual reports are the same. Companies structure their annual reports to provide shareholders perspectives for the industry they operate in. Having said that, some of the sections in the annual reports are common, which are what we are interested in.
Note: In case how I narrow down my selection process, take a look here.
Some US companies, like Tesla, do not create a reader-friendly annual report. Instead, they file their annual reports, called 10-K’s, to the SEC. The 10-K’s can be slightly more confusing to read.
Another important thing to note is that companies generally provide a pretty rosy picture in their annual reports, that’s why you need to do a deep examination of the annual report, especially in the sections that have different financial numbers.
For reader-friendly annual reports, I pay special attention to the following sections:
- Financial Highlights
- The Business / The Management Statement
- Management Discussion & Analysis
- Ten-Year Statistical Review
For 10-K’s, I pay special attention to the following sections:
- Business
- Risk Factors
- Selected Financial Data
- Management’s Discussion and Analysis of Results of Operations and Financial Condition
- Financial Statements and Supplementary Data
Let’s dig deeper into the different sections.
Royal Bank Annual Report Analysis
Financial Highlights
This section gives you a quick overview of how the company did in the past corporate year.
Below is the financial highlights snapshot from Royal Bank’s 2018 annual report.
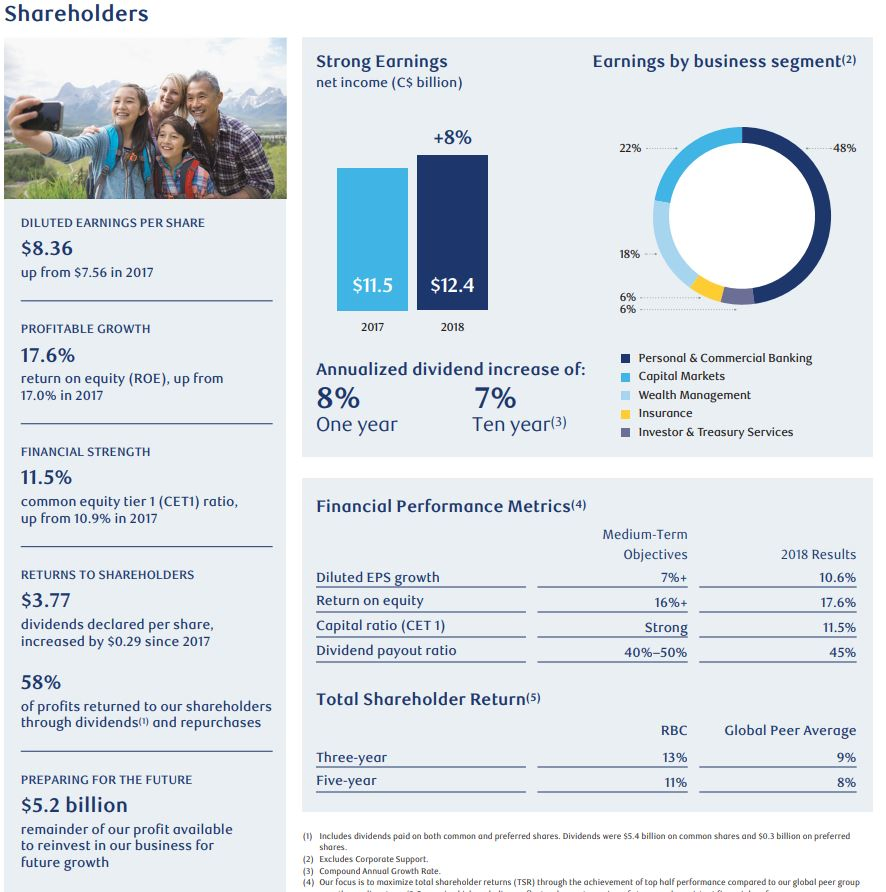
From a quick look, I noted the following:
- Diluted earnings per share went from $7.56 to $8.36, a 10.6% increase. This is good.
- Earnings went from $11.5B to $12.4B, an 8% increase. This is good.
- Return on equity went from 17% to 17.6%, a slight improvement compared to 2017. An ROE of above 15% usually is good.
- Royal Bank ends up beating all its financial medium-term objectives in 2018. This is great!
- Annualized dividend increase of 8% in one year and 7% in 10 years. As a dividend growth investor, that’s music to my ears.
- $5.2 billion of profits available to reinvest back into the company for future growth. That’s about 42% of the 2018 annual profit (and why it says 58% of profits are returned to shareholders). Typically, you want to see that a company is reinvesting profits for future growth. For a very mature company like Royal Bank, the profit reinvestment for future growth won’t be as high as a growth company like Shopify for example.
In Royal Bank’s case, all these financial highlights look quite promising. The company is doing well overall.
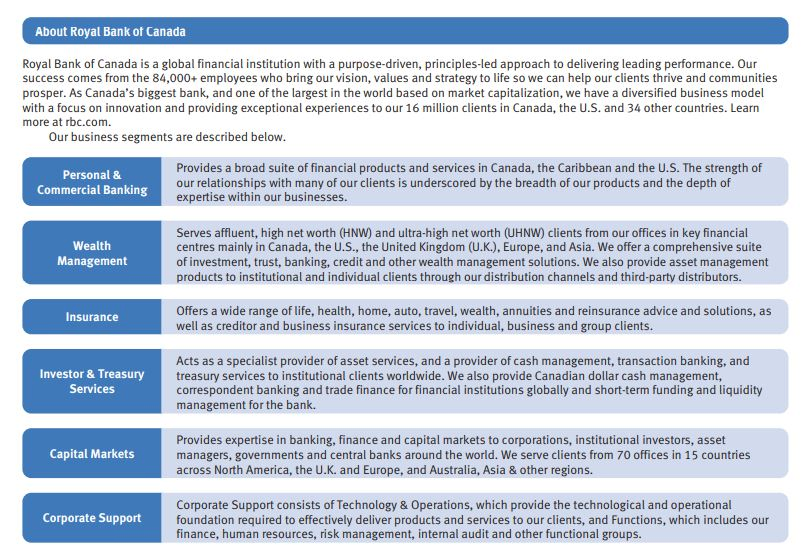
The Business / The Management Statement
I like to read about what the management has to say about the company and its overall business environment. I can usually pick out a few key insights and information from this section in the annual report. This is especially important when I am trying to learn about a new company that I am interested in.
Here’s the message from Dave McKay, President and CEO of Royal Bank, to shareholders. I highlighted the parts I paid attention to, which are:
- CET1 ratio to 11.5%. I thought this was interesting to point out since the higher the CET1 ratio, the better.
- Using AI and machine learning to provide cutting edge trading strategies and improve insights to customers. Working to provide more innovative products in the future. I thought this was interesting, shows the Royal Bank is looking to improve its products.
- A bold goal to acquire five million new relationships and grow clients to three times the current client acquisition rate, or 2.5 million plus new clients by 2023. This shows that the company has a BHAG goal to attain more customers. A good sign.
- 23% of revenue from the US. Earnings from the US were up 13%.
- Currently 16 million clients

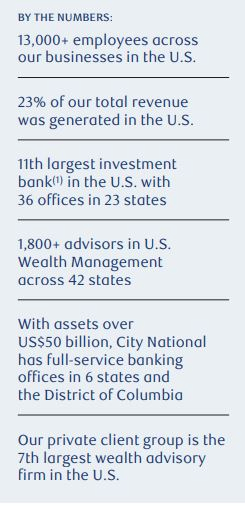
Scanning through the rest of The Business / The Management Statement section, I also noted some interesting numbers and facts:
- 11th largest investment bank in the US
- 1,800+ advisors in US Wealth Management across 42 states
- Private client group is the 7th largest wealth advisory firm in the US
This is showing me that Royal Bank is expanding and growing in the US. For me, geographical diversification is always a good idea.
Management Discussion & Analysis
The Management Discussion & Analysis in the annual report is the most important section, in my opinion. As an investor, I would spend a lot of time going through the numbers in this section and doing my own calculations to determine whether the business is growing or deteriorating.
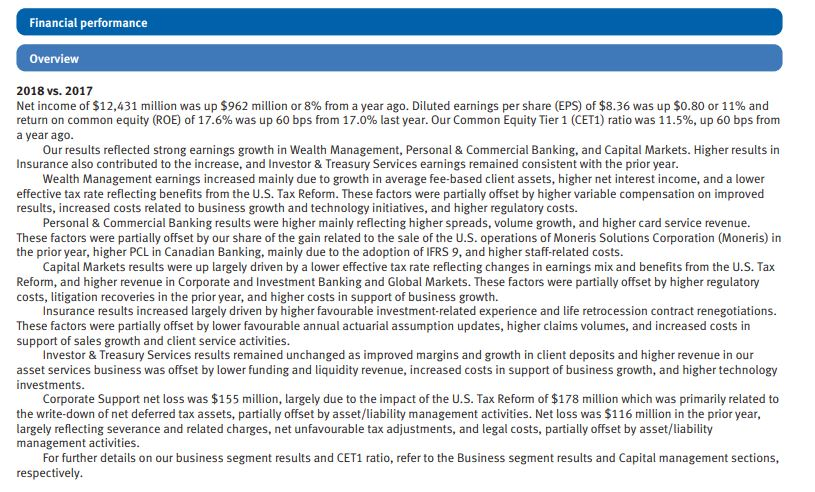
Overview and outlook
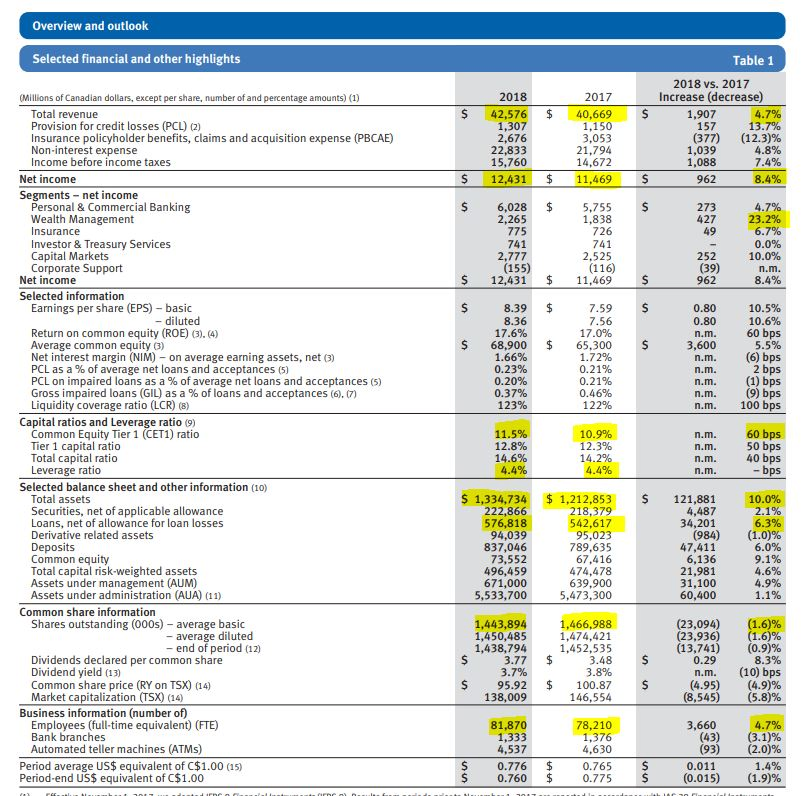
This is usually the first time in the annual report that you’ll see a bunch of numbers in a table. I highlighted some numbers that I found interesting. As noted, the total revenue has increased by 4.7% (a good sign) and the net income increased by 8.4% (also a good sign). When I looked at income from the different segments of the business, I noted that the Wealth Management segment is growing faster than the other segments. All the business segments, except for Investor & Treasury Services, are growing. This is expected since the overall business has grown between 2017 and 2018. It is always worthwhile to see if any business segments generated less net income than the previous year. If so, I usually want to take a closer look within the annual report to find out the reasons for the decline.
One thing to note is that the provision for credit losses went up in 2018 by 13.7%. Given the Canadian housing market concerns, it is a bit concerning to see an upward trend.
The Common Equity Tier 1 (CET1) ratio, a component used for banks and financial institutions, grew by 60 basis points. This means Royal Bank has strengthened their capital against its risk-weighted assets. It’s leverage ratio remains the same as 4.4%, which is a good sign since this means Royal Bank has not increased its liability exposure.
The total assets increased by 10%, which is good. Loans increased by 6.3%, which means Royal Bank loaned out more money to wholesale loans and residential mortgages. Given the so-called Canadian housing bubble, this can be interpreted as a bad thing if you are worried about loans getting defaulted.
The common shares outstanding decreased, which means that Royal Bank has been buying back shares. This is a good sign for investors.
Finally, the number of full-time employees have grown by 4.7% while the number of bank branches and ATMs have decreased. This means that Royal Bank has closed down some branches while increasing number of employees within each branch. This can mean that Royal Bank is trying to be more efficient at each branch and trying to cover a larger area with each branch than previously.
In the same section of the report, Royal Bank provided more description of the business segments and the performance of each segment. For Royal Bank, it is important to continue to grow all six segments of the business.
Economic, market and regulatory review and outlook
Royal Bank also provided an outlook in the annual report which basically tells me that the Bank expects to see modest growth in 2019 and expects the central banks in Canada, the US, and the EU, to continue to raise interest rates.
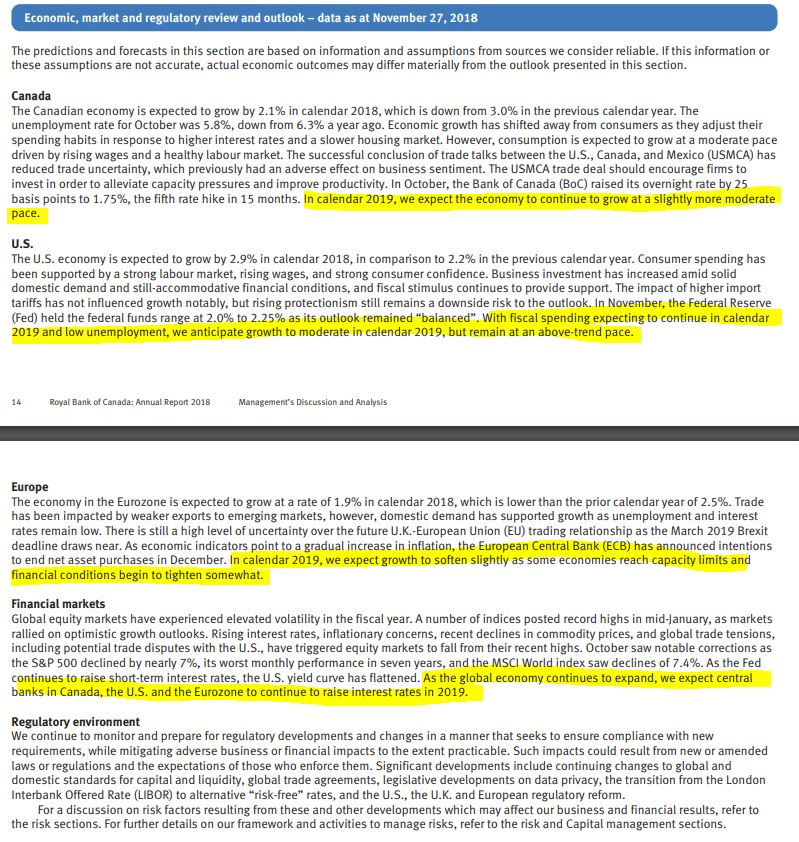
According to these factors provided by Royal Bank in the 2018 annual report, I expect that the Royal Bank stock price will see modest growth throughout 2019.
Additional financial numbers
Within the Management Discussion & Analysis section of the annual report, Royal Bank further broke down the financial numbers for each business segment and the different business regions, which can be quite interesting to examine if you want to take a deep dive into how the company is doing.
For me, I usually scroll past these super-detailed sections and go straight to the quarterly results and trend analysis section.
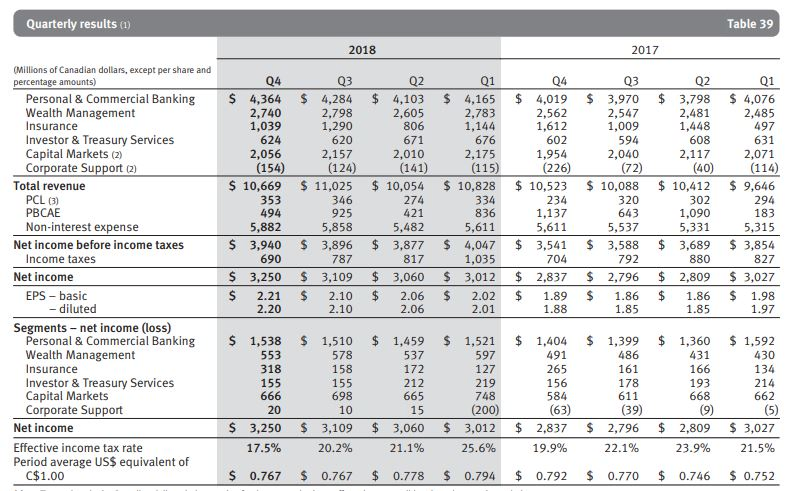
Some businesses can be quite seasonal, so it’s nice to be able to compare the quarterly results. In this section, Royal Bank pointed out that the first quarter is historically stronger for the Capital Markets businesses. Since the second quarter has fewer days, this generally resulted in a decrease in net interest income and certain expenses items. Based on a quick look at the table below, I noted that Royal Bank was able to increase revenue and net income every quarter in 2018 compared to 2017. This means the Bank is consistently growing every quarter. When I looked at the quarterly EPS, I saw a positive trend. The quarterly EPS grew consistently in 2018. This was not the case in 2017 where Q1 had the highest EPS.
It was also interesting to note that the effective income tax rate varied greatly over the eight quarters. Royal Bank pointed out in the analysis section that the first quarter of 2018 tax rate was adversely impacted by the US Tax Reform, which resulted in the write-down of net deferred tax assets.
Next, I took a look at the condensed balance sheets:
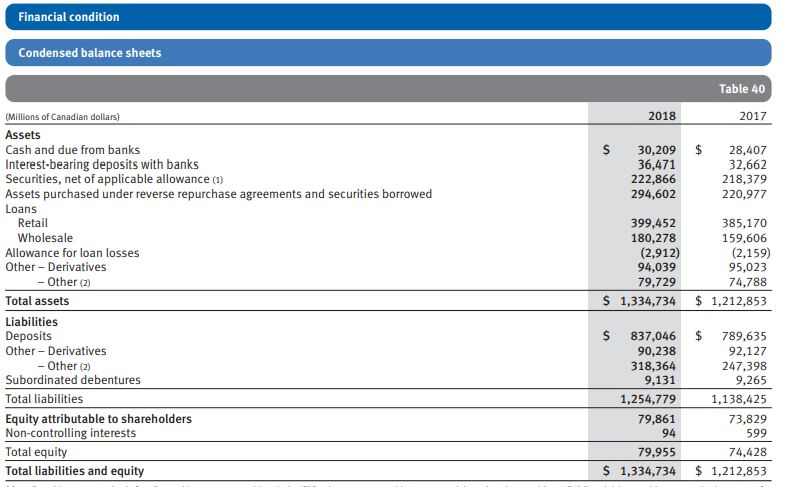
Here I noted that both total assets and total liabilities trended upward in 2018. Ideally, you want to see the liabilities to trend downward. But when I took a closer look, I noticed that most of the liability increases came from Deposits (i.e. more customers putting more money in Royal Bank) and Others. I have no idea what Others meant, so I took a closer look at the footnote which stated “other assets and liabilities included segregated fund net assets and liabilities”. In the text section following the numbers, Royal Bank pointed out that the foreign exchange translated an increase of total liabilities by $15 billion or about 0.1% of its total liabilities.
In case you are not familiar with the accounting basics, when it comes to a company’s balance sheet, total assets must equal to total liabilities. That’s why you see the numbers match in the above table.
Risks
As an investor, it’s important to understand what kind of risks the company faces. Lucky for me, Royal Bank highlighted some of the potential risks for the company.
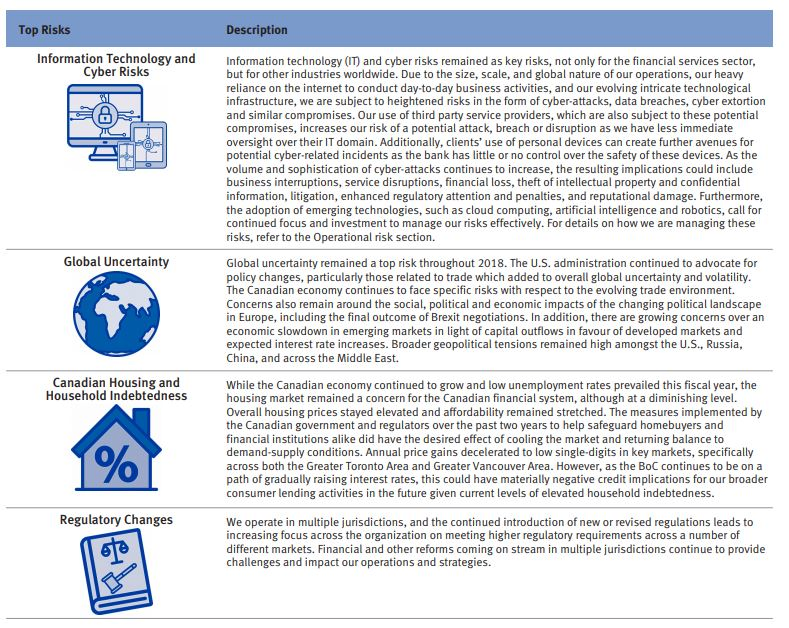
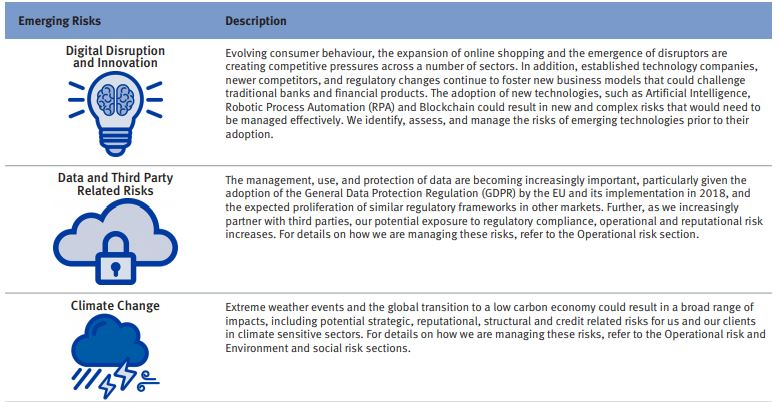
Often it’s worthwhile to go back to the previous years’ annual reports and compare the risks that the company mentioned to see if anything has changed.
Ten-Year Statistical Review
The final section I like to take a look in the annual report is the ten-year statistical review. This gives me a quick overview of how the company has done is the past 10 years.
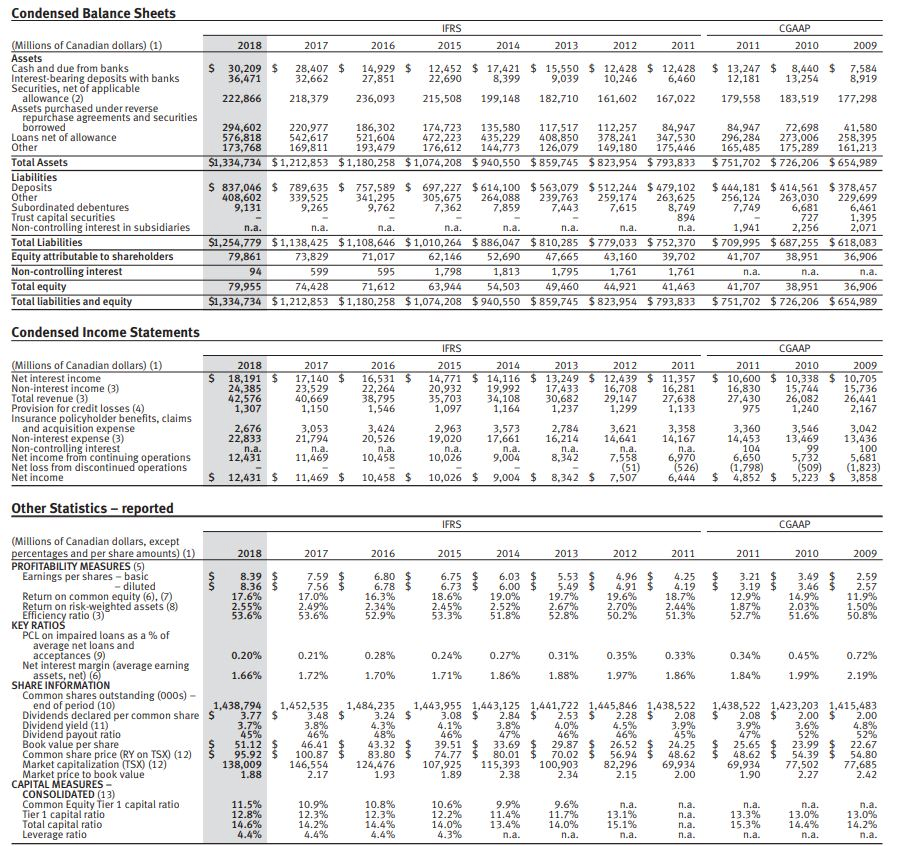
I would usually look at the numbers quickly. In Royal Bank’s case, I noted that the total assets has grown consistently over the last 10 years. Similarly, the net income has increased too. This is a good sign. There’s an upward trend on EPS in the last 10 years, which is good. The return on common equity rate has bounced around but has improved compared to 2009 (i.e. the financial crisis), but if we look at the efficiency ratio, the ratio stays above 50% consistently, which is good.
From a dividend point of view, the dividend payout ratio consistently stayed below 50%, with the exception of 2009 and 2010. The book per share has also consistently increased over the years. It’s interesting to see that the historical market price to book value is about 2. This quickly showed me that the Royal Bank price should be in the $102 range if its book value is $51.12 per share.
Should I invest in Royal Bank?
If I had to decide whether to invest in Royal Bank stocks or not, based on the annual report, I would come to the conclusion that Royal Bank has solid performance. It makes sense to invest in Royal Bank stock. If I had to look for a price entry, I would say around or below $100 is quite attractive. But before I pull the buy trigger, I would want to take a look at the latest quarterly report, which I will go over later in this post.
Tesla Annual Report Analysis
Since the 10-K looks a lot different, I thought it would be good to go over it and show readers what numbers I look for when I go through a 10-K report.
Business
The business section gives a good in-depth overview of what the company does. In Tesla’s case, the company designs, develops, manufactures and sells high-performance fully electric vehicles (EVs) and energy generation and storage systems; the company also installs and maintains such energy systems and sells solar electricity. In the report, Tesla provided a lot of details for each segment of its business.
If you’re an investor looking at a company that you’re not familiar with, I think this section is very good to scan through to understand the business model. For example, thanks to this section, I learned that Tesla expects the new Model Y will share about 75% of its components with Model 3, which should reduce the cost and time to ramp production of Model Y. I also learned that Tesla provides a 30-year installation and a 30-year weatherization warranty and a power output warranty on their Solar Roof.
As part of this section, Tesla stated that as of December 31, 2018, the company had 48,817 full-time employees. I had no idea the company has that many full-time employees!
Risk Factors
As previously stated, I believe that as investors, it is important to understand what kind of risks the company you are investing in may face. In this section, Tesla identified many risks such as:
- Delays or other complications in the design, manufacture, launch, production, delivery and servicing ramp of new vehicles and other products
- Delay in project timelines and cost and volume targets as one of the risk factors
- The population’s willingness to adopt electric vehicles, specifically Tesla’s vehicles, was identified as a potential risk too.
- Achieving targeted manufacturing costs for Tesla vehicles
- Competition from new and established domestic and international competitors. Tesla expects to face competition from others in the future, including competition from companies with new technology.
- Highly dependent on the services of Elon Musk
All together, Tesla highlighted 21 pages worth of risk factors that the company faces. To me, that paints a picture that the overall business is quite risky. Tesla certainly faces many challenges.
Selected Financial Data
This section is typically the first time in the 10-K report that we see financial numbers. This gives us a quick overview of how the business is doing. In Tesla’s case, I noted that the total revenues have exploded since 2014, as a result, its gross profit has increased significantly over the last four years as well. This, however, shouldn’t come as a surprise for a hyper-growth company like Tesla.
What’s interesting is looking at non-profit numbers:
- Loss from operations – This is all over the place over the last five years with no trend established.
- Net loss – Again this has been all over the place. Tesla has not shown that it can decrease net loss over the last five years since going public.
- Net loss per share – Some very ugly numbers. In 2017, the company had a $11.83 loss per share. This number almost halved in 2018 to $5.72 loss per share but that’s still not great considering the Tesla stock price. When will Tesla see a positive EPS, I wonder?

Management’s Discussion and Analysis of Results of Operations and Financial Condition
As we saw in the Royal Bank annual report example, the Management’s Discussion and Analysis of Results has a lot of numbers and can be a great tool to help us understand the financial condition of the company and its future outlook.
Overview and outlook
First, the Tesla management provides an overview and 2018 highlights. In 2018, Tesla sold three car models: Model S, Model X, and Model 3. Tesla produced 254,530 vehicles and delivered 245,506 vehicles, or a YoY increase of approximately 152% and 135%, respectively. A quick Google search showed that BMW Group sold 2.49 million vehicles and Mercedes-Benz sold 2.3 million vehicles in 2018. So Tesla has a long way to go to catch up to these two luxury brands.

For its energy generation and storage business, Tesla deployed 1.04 GWh of energy storage products, nearly tripling its deployment compared to 2017. The company also deployed 326 MW of solar energy generation during 2018.
Management Opportunities, Challenges and Risks and 2019 Outlook
In this section, Tesla stated that they commenced production of Model 3 for Europe and China and expect to continue to grow Model 3 production to a sustained rate of 7,000 vehicles per week by the end of 2019. So if Tesla has an average of 80% of this capacity throughout 2019, that’d result in 291,200 Model 3 vehicles; this would beat the total number of vehicles they manufactured in 2018. If I assume that the volume of Model S and Model X is 30% of Model 3, that would result in 87,360 Model S and Model X vehicles. Based on my rough estimate, this would mean Tesla would manufacture 378,560 vehicles in 2019.
Tesla plans to continue to optimize and simplify Model 3 production. By discontinuing some custom orders of Model S and Model X, Tesla hopes to focus on production optimization on its high-end models. From a manufacturing point of view, the less SKU’s (Stock Keeping Unit), the easier your manufacturing process which also reduces your overall operational cost. For those who are not familiar with the term SKU, it basically means the different configurations of the same product. For example, a car model may have three different trims, five different colour options, and three different interior options. This means for this particular car model, there are 45 different SKUs. As you can see, things can get quite complicated if a company has a lot of SKUs.
When it comes to energy storage products, Tesla is working to reduce customer acquisition costs to help increase its sales. Tesla expects significant growth from this business segment and targets more than double its deployments to over 2 GWh in 2019.
From the selected financial data above, we know that Tesla is spending a lot of money. For the 2019 outlook, Tesla pointed out that its capital expenditures in 2019 are projected to be about $2.5 billion and expects operation expenses in 2019 to grow by less than 10% from 2018.
Financial Statements and Supplementary Data
Unlike other companies’ 10-K reports, the Tesla 10-K reports contained a lot of text. Because of this, I wanted to focus more on the financial numbers the company provides within the annual report.

In the above table, I noted that Tesla’s YoY revenues are increasing at a very high rate. It grew its total revenues by 68% from 2016 to 2017 then grew by 83% from 2017 to 2018. In 2018 Tesla had $21.5 billion in revenue. Given the past performance, I would conservatively estimate Tesla to grow by 70% in 2019, resulting its revenue to be around $36.55 billion.

In the chart above, I noted that Tesla’s automotive sales have increased significantly from 2016 to 2018, due to the increase of Model 3 production. The introduction of Model 3 in Tesla’s vehicle line affected the increase in automotive leasing and services revenues.
What I find particularly interesting is that Tesla’s automotive segment saw a 23% gross margin and its energy generation and storage segment saw a 12% gross margin in 2018. For some reason, the gross margin of the energy generation and storage segment was not very consistent. Tesla pointed out in the report that the decrease in gross margin was primarily due to the higher proportion of energy storage in its overall energy generation and storage portfolio, due to a three-fold growth of MWh of energy storage deployment. In other words, investors should expect this segment to continue to operate in low margin percentage.
Overall, Tesla ran a margin of 19% in 2018. In comparison, BMW’s margin is about 20% and Volkswagen’s margin is about 18.5%. So Tesla’s automotive segment gross margin is roughly align with the two competitors.

In terms of R&D expense, it appears this expense has somewhat stabilized for Tesla. The YoY change between 2017 and 2018 is below 10%, and as a percentage of revenues, Tesla only spent 7% of its revenue on R&D. Typically for a high-tech company, I would expect this number to be higher. Hopefully Tesla has found ways to reuse and leverage its existing designs for future generations of vehicles and energy storage to optimize its R&D expenses. Given that Tesla noted Model Y will use 75% of the same components as Model 3, I’d expect Tesla has found a way.
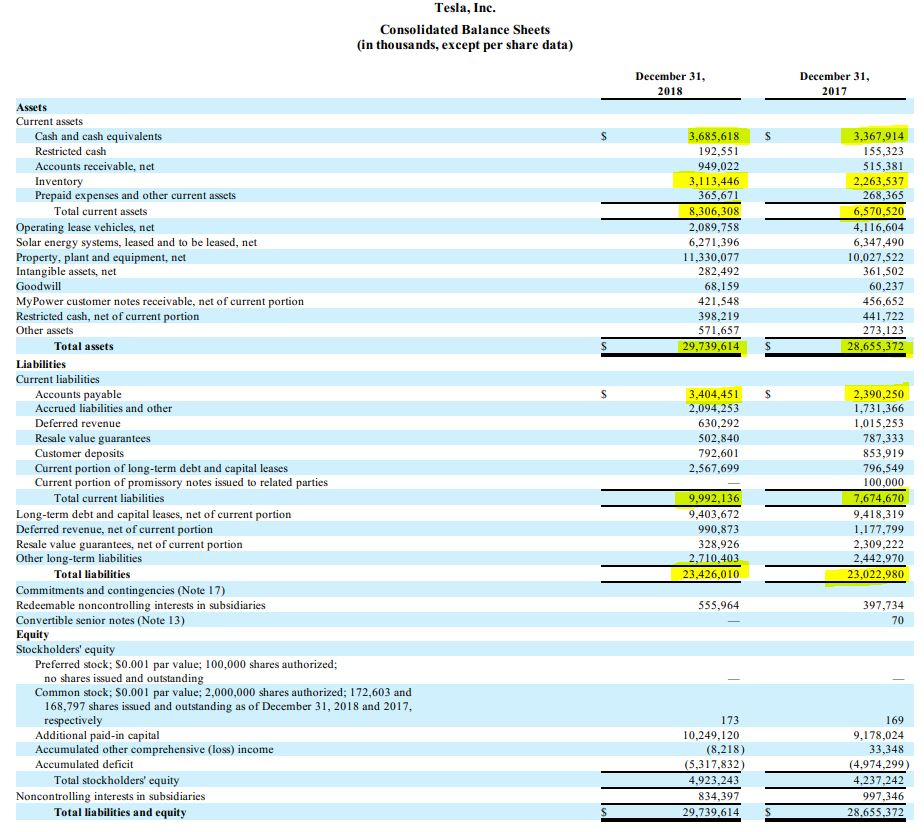
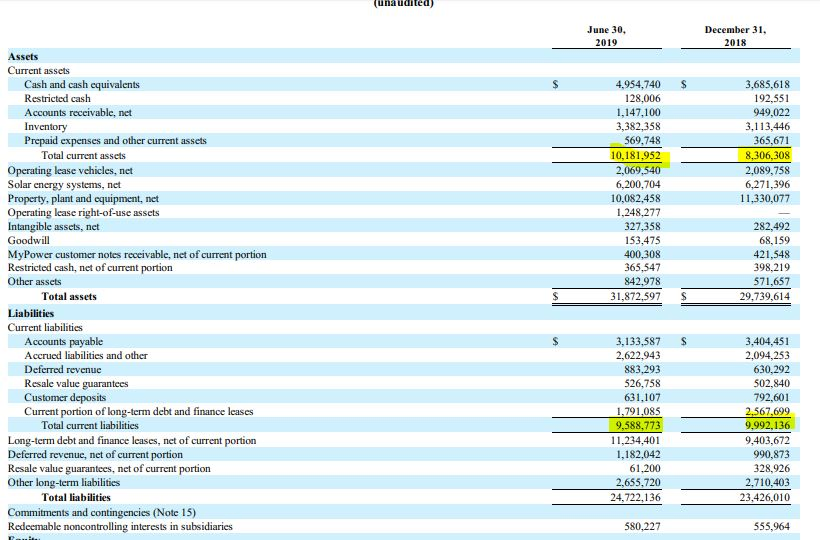
When I looked at Tesla’s balance sheet, I see that the total current assets increased by 26.4%. On the other hand, the total current liabilities increased by 30.2%. So Tesla’s current liabilities grew faster than its current assets. That’s not exactly a great sign.
Better telltale signs of how Tesla’s business is the consolidated statements of operations. Most of these numbers were shown throughout the annual report already but it was good to see all of them consolidated.
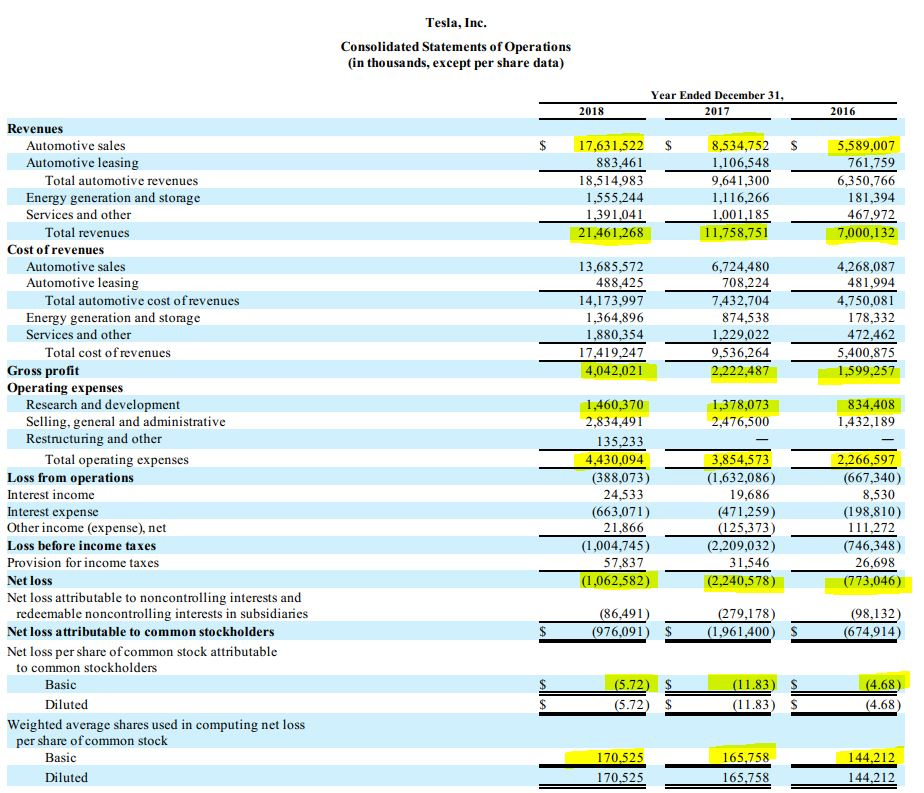
A quick calculation showed that Tesla’s actual gross margin is 18.8%, rather than the 19% that it stated previously (they must have rounded it up). It had a net loss of about $1.1 billion in 2018, which was lower than the net loss from 2017. This indicated that the company’s financial health had improved. As pointed out earlier, the company had a net loss per share of $5.72. In other words, Tesla’s price to earning ratio is negative!
Should I Invest in Tesla?
While Tesla has improved its revenue from 2017 to 2018, the company was still running at a big net loss. With its gross margin in the teens, I would definitely want to take a closer look at its latest quarterly results before deciding.
How to read quarterly reports
For the most part, quarterly reports are very similar to annual reports. Quarterly reports give investors a more up-to-date financial performance of the company and generally has less text and more numbers compared to annual reports. After going through the latest annual report of a company, I would usually proceed to read quarterly reports of the last few quarters to see if the financial conditions have changed or not. Some out the things I look out for are:
- YoY quarterly performance comparison
- Year to Date (YTD) comparison
- Did the company meet street expectation?
- Future guidance
Some companies, like Royal Bank, provides a readers friendly quarterly report. Some, like Tesla, simply files the 10-Q reports, which are less reader friendly.
Royal Bank Quarterly Report Analysis
After going through Royal Bank’s 2018 annual report, I believe Royal Bank is performing quite well. I needed more confirmation and for that I would look at the latest quarterly report.
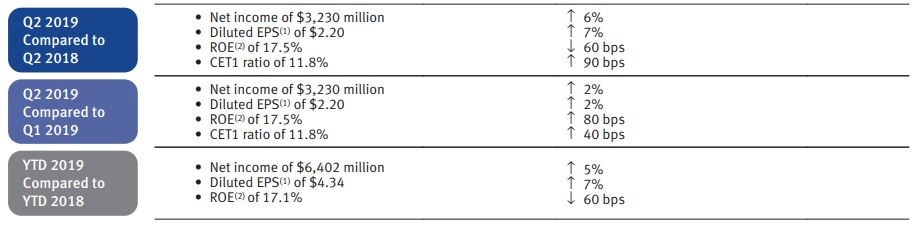
According to Royal Bank’s Q2 2019 report, the company had a net income of $3.32 billion for the quarter ended April 30, 2019, up 6% from Q2 2018. Diluted EPS grew by 7% with ROE improved by 60 basis points to 17.5%. Compared to Q1 2019, Q2 2019 saw modest growth. When compared to YTD performance, 2019 net income increased by 5%, diluted EPS increased by 7%. All these results are pretty solid.
Selected financial and other highlights
In this section of the quarterly report, Royal Bank provides an overview of the Q2 performance. What is interesting in this table is that you can compare to the previous quarter in the same year and the same quarter in the previous year.
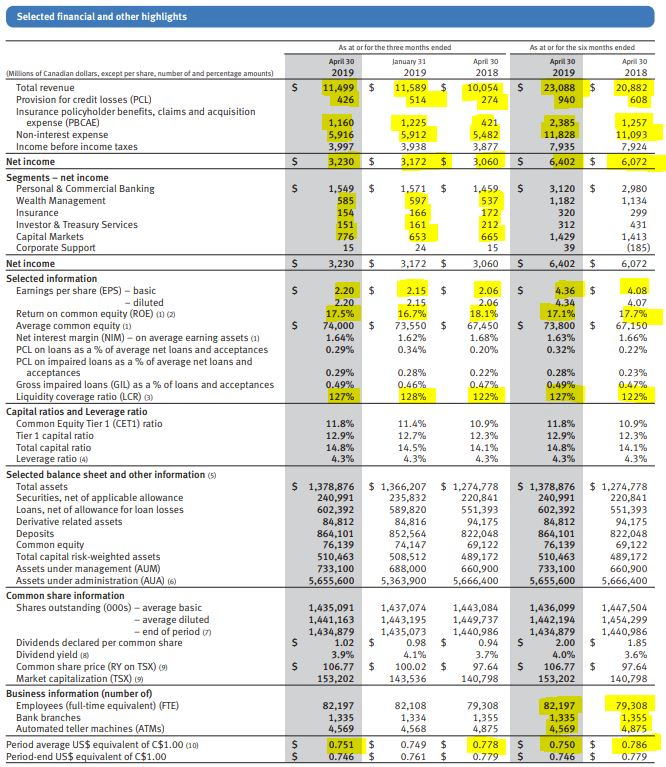
I quickly noted that the net income increased compared to the other quarters (and as of the six months ended). Earning per share is trending upward, so is ROE.
It’s interesting to point out that from a business segment point of view, Wealth Management, Insurance, and Investor & Treasury Services saw a decline in net income. I quickly scrolled to the text description later in the quarterly result and noted that Investor & Treasury Services earnings decreased due to lower funding and liquidity revenue and lower revenue from Royal Bank’s asset services business. Insurance was down because lower favourable investment-related experience and increased disability and life retrocession claims costs. With respect of the Wealth Management decrease between Q1 and Q2 2019, Royal Bank explained the decrease was due to favourable accounting adjustment related to Canadian Wealth Management in the prior period, and lower net interest income as volume growth was more than offset by lower spreads of three less days in the quarter. The explanations were satisfactory to me.
One key thing to note is that the provision for credit losses continued to climb compared to Q2 2018. However, this number was lower compared to January 31, 2019. When I looked deeper and studied the lines “PCL on loans as a % of average net loans and acceptance” and “PLC on impaired loans as a % of average net loans and acceptance,” I see them both at 0.29%, a slight increase compared to Q2 2018 but not by much.
Full-time employees continued to grow while bank branches and ATM’s continued to decrease. This was the same trend we saw in Royal Bank’s 2018 annual report.
Since the results are in Canadian dollars, I noted that the CAD:USD exchange rate went up in the latest quarter. This means for every $1 US Royal Bank earns, it gets an extra $0.06 in CAD when compared to results from 2018. Given that Royal Bank is expanding into the US, that means an increase in US revenue can significantly improve Royal Bank’s results.
Outlooks & Risks
Just like the annual report, Royal Bank highlighted outlooks and risks it faces moving forward.
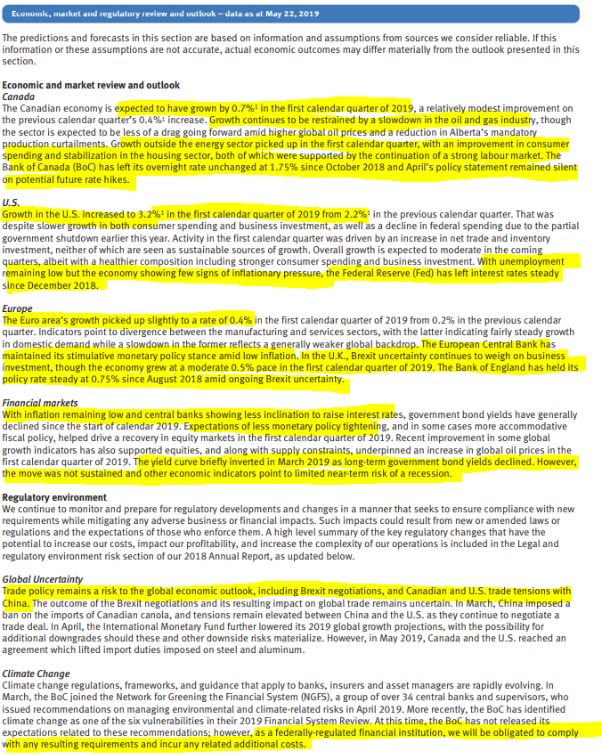
My take is that the global economy is improving but there are a lot of uncertainties given Brexit and the trade tensions. Based on the Q2 analysis, I would continue to expect Royal Bank to see a modest growth in 2019 (same as my analysis from the 2018 annual report).
Since the Canadian housing market is weighing on the performance of Canadian banks, I wanted to take a closer look at Royal Bank’s credit risk exposure.
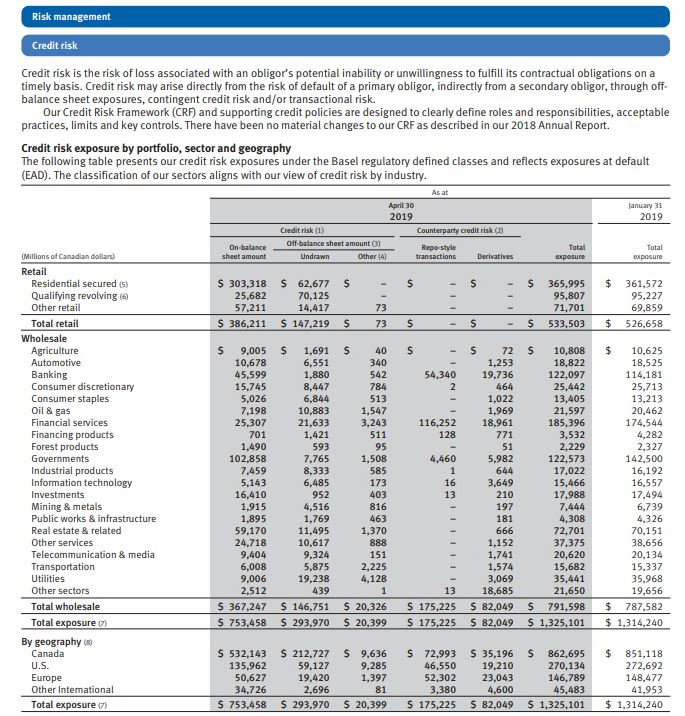
As expected, Canada marked up a large portion of Royal Bank’s credit risk. The residential secured exposure was $366 million or about 27.6% of the total exposure.
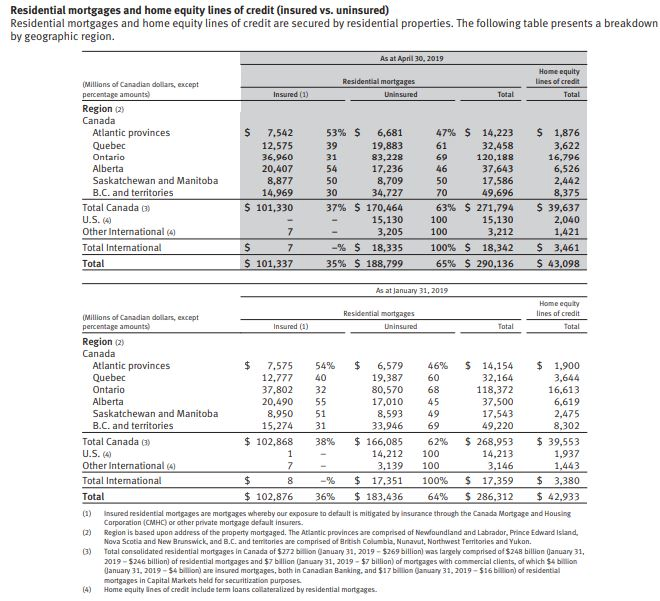
Looking further I see that 37% of the residential mortgages are insured and rest (63%) is uninsured. Compared to Q1 2019, the numbers didn’t change a whole lot. The large percentage of uninsured residential mortgage is a bit of a concern.
Expectations and Guidance
For expectations, I usually need to do some quick Google searches. From my Google searches, I found that analysts on average had expected earnings per share of $2.21. Since Royal Bank showed an ESP of $2.20 in Q2, that meant Royal Bank missed the ESP estimate slightly.
Royal Bank did not provide its Q3 2019 guidance but the analysts had an average estimate EPS of $2.31. Meaning Royal Bank needs to increase its EPS by $0.11 in Q3. Given that Royal Bank has about 1.44 billion shares outstanding, that would mean an increase of $157.9 million in earnings, or about 4.9%.
Should I invest in Royal Bank?
Based on the latest annual and quarterly reports, I noted that Royal Bank’s business is solid. The company faces some challenges like credit losses but this may have been stabilizing. Given that Royal Bank consistently make over a billion dollars in revenue, result in millions of net income, grow dividends consistently, I would invest in Royal Bank based on the notion that its share price is about two times its book value. At a book value in the mid-50’s, that means I’d expect the stock price to be around $100-$110 range. If the price falls below that amount, it would be mean that the stock is at a bargain.
Tesla Quarterly Report Analysis
As a potential investor, I was a bit wary of Tesla’s financial performance after reading its latest annual report. Therefore, it is especially important to examine the latest quarterly report to see how Tesla is doing. A few questions I wanted to get answered include:
- Is the company making money (i.e. positive EPS)?
- What’s the revenue? Is it growing?
- How many vehicles does Tesla expect to manufacture and sell in 2019?
- How many vehicles did Tesla deliver so far in 2019?
Let’s dive right in!
Consolidated Balance Sheets
According to the consolidated balance sheets, Tesla saw an increase of about $1.8 billion in current assets and reduced its current liabilities by about $400 million in the last six months. This is a nice trend.
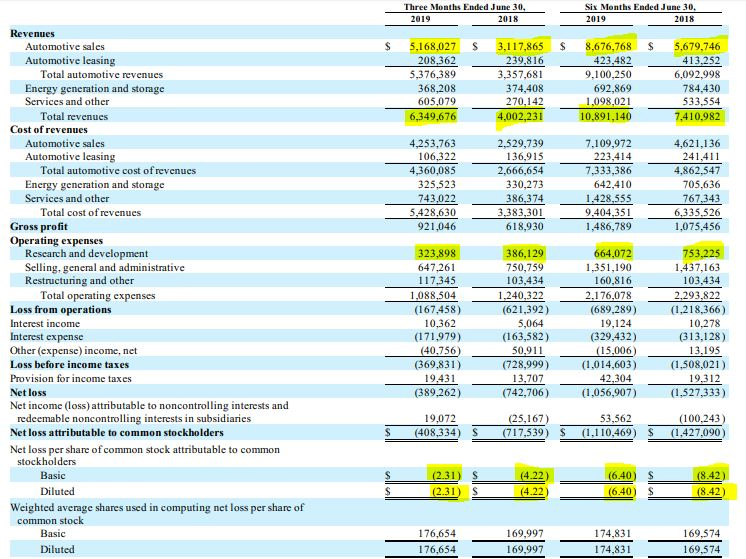
As expected, the vehicle sales had increased significantly. The R&D cost had reduced, which indicates that Tesla has perhaps leveled off on its R&D expenditure as the EV technology matures. As a result, operation expenses were lower but I am not sure if Tesla can continue with the lower Opex trend. The EPS is still negative, meaning that the company is still losing money, but a significant improvement over the previous quarters. As Tesla manufactures and sells more vehicles, mainly Model 3, it is an expectation that the company will start turning things around.
While the numbers looked promising, Wall Street analysts were expecting revenue of about $6,375 billion for Q2 and a loss of $0.54 per share. Tesla’s $6,349 billion in revenue beat the expectation but the loss of $2.31 per share was significantly higher than the expectation. Needless to say, the big gap in EPS caused the Tesla share price to drop after the Q2 results announcement.
Given that Tesla is still on track with their expectation of selling 360,000 to 400,000 vehicles for 2019, mostly Model 3’s, it is quite concerning to me that Tesla still cannot make net profits for the last quarter. Tesla couldn’t seem to make any profits when they were manufacturing and selling Model S and Model X. With Model 3 taking up the majority of their sales, Tesla still can’t manage to make sustainable profit, despite record volumes. I do wonder how Tesla will ever become profitable.
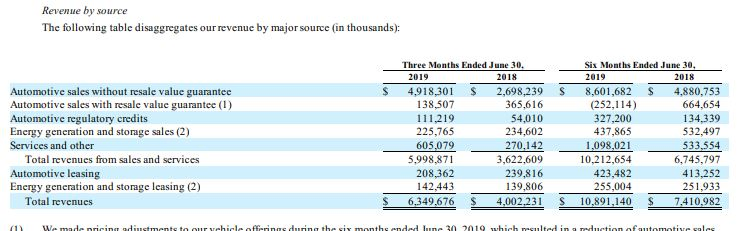
When it came to revenues by sources, Tesla’s revenues came primarily from the automotive sales and services. This didn’t come as a surprise. However, it is concerning to see that a decrease in revenues and profit in the energy generation and storage segment.

Management’s Discussion and Analysis of Financial Condition and Results of Operations
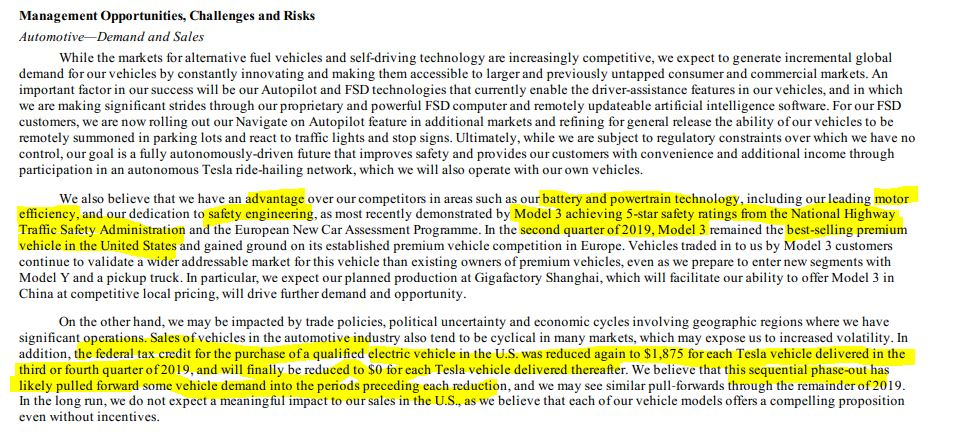
According to Tesla’s management, Model 3 continued to be the best-selling premium vehicles in the US and gaining ground in Europe. As the federal incentives for electric vehicles start to dry up, it will be interesting to see how that impacts Tesla’s overall revenue. Would less people be willing to pay the full amount for a Tesla vehicle? This factor alone, will create a lot of uncertainties in Tesla’s future profitability.
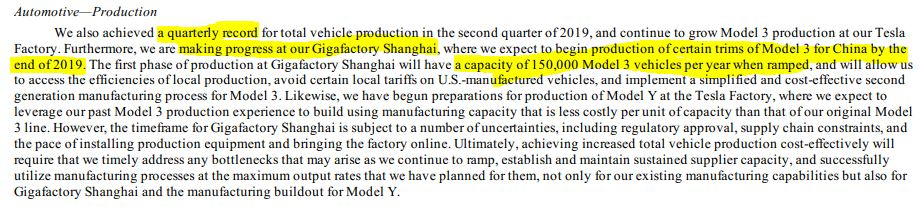
Telsa management pointed out that they had a quarterly record for total vehicle production. As they ramp up at the Gigafactory in Shanghai, the company expects Model 3 capacity to increase to 150,000 vehicles per year in China alone. Gigafactory Shanghai will be an important production ramp for Tesla moving forward.
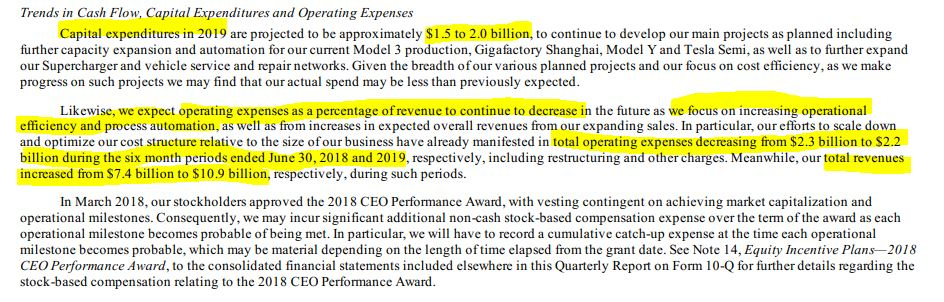
Tesla management also pointed out that Capital expenditures will be approximately $1.5 to $2 billion. The operation expenses as a percentage of revenue will continue to decrease as the company focuses on operational efficiency and process automation. Total Opex decreased from $2.3 billion to $2.2 billion during the first six months of 2019 compared to the same period in 2018, while total revenues increased from $7.4 billion to $10.9 billion. While the total revenue continues to increase, I continue to have my doubts on if Tesla can eventually make net profits.
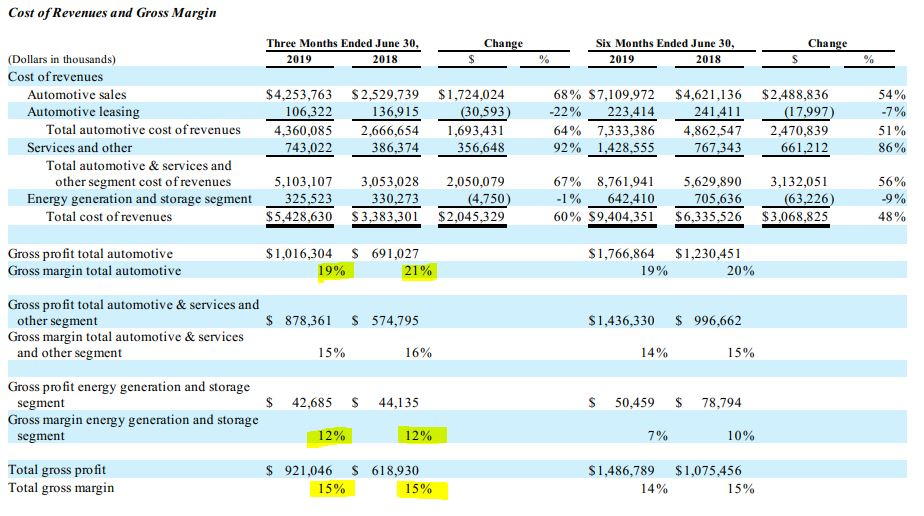
While Tesla had increased its revenues, it was particularly interesting for me to note that the gross margin percentage had decreased. In the 2018 annual report, Tesla reported an overall total gross margin of 19% for 2018 with a 23% gross margin for the automotive segment and a 12% gross margin for the energy generation and storage segment. The gross margin for the automotive segment had decreased, which resulted in a lower total gross margin. Tesla stated that the decrease was primarily related to lower Model S and Model X deliveries at lower margins due to lower average selling prices from price adjustments Tesla made. This decrease was partially offset by the improvement of Model 3 margins as Tesla achieved significant manufacturing efficiencies in the production of Model 3 in the second half of 2018 and the first half of 2019.
As usual, I think the management is trying to put a good spin on the reduction in gross margin. A decrease in gross margin percentage is not a good sign for any company. It is especially not good for a company still trying to make net profits for the first time in company history. Again, I do wonder if and when Tesla can continue to improve its operational efficiency to result in higher gross margin in the near future.
Risks
Just like in its 2018 annual report, Tesla provided almost 20 pages of risks in its 10-Q report. I am not going to point out all the risks but as you’d expect, Tesla is facing a lot of uncertainties for its business. Therefore, Tesla is considered a much riskier investment compared to Royal Bank. It’s not for the faint of heart.
Expectations and Guidance
Tesla had provided an expected annual car delivery guidance of 360,000 to 400,000 cars for 2019. This number appears to be on target. Previously the company announced that they expect to return to profitability in Q3 but in the Q2 results, Tesla stated that they continue to aim for positive GAAP net income in Q3 and the following quarters, although continuous volume growth, capacity expansion and cash generation will remain the main focus. This didn’t exactly give me a warm and fuzzy feeling. In other words, I suspect Tesla is expecting a loss in Q3 and they want investors to shift their focus away from net positive income and focus on volume growth, capacity expansion, and cash generation instead. For me, this is a sign of management trying to manipulate market expectations.
Should I Invest in Tesla?
From the 2018 annual report and the latest quarterly report, it’s clear that Tesla continues to report losses and is burning cash like no tomorrow. Although most investors remain positive due to the increasing sale of Model 3, with a challenged gross margin and operational challenges, I believe it will get harder and harder for Tesla to raise capital. As a potential investor, there are a lot of warnings and red flags within Tesla’s financial reports. While Tesla stock price can soar to new highs, it’s just as likely to tumble to new lows. For me, it simply doesn’t make sense to invest in Tesla stock unless I can start seeing net profitability and gross margin improvements.
Final Thoughts
Phew, that was a LONG post with a lot of numbers and analysis. It was definitely tough to go through the financial reports of both companies and write about them. However, I hope my analysis of the reports demonstrated how I determine whether it makes sense to invest in a company or not.
Whether you have already invested in a company’s stock or you are considering investing, I believe it’s important to read through the company’s annual and quarterly results.
Dear readers, did you find this post useful? I’d love to hear your thoughts.
Hi,
Very informative, thanks. Quick question,
Just before the section “Should I invest in Royal Bank?”, you explain “..historical market price to book value is about 2”. I can see Market Price to Book Value in the Condensed Balance Sheet provided above however I’m not sure, is this figure what is commonly referred to as Price/Book (P/B)?
Yes that’s correct.
Great walkthrough! Much appreciated.
You’re welcome, glad to see that you enjoyed it.