
Long-time readers know that I have been writing monthly dividend income updates as a way to keep us honest and demonstrate that it is possible to build a sizable dividend portfolio. Like many dividend growth investors, our goal is to have our dividend portfolio generating sufficient dividend income to cover our expenses so that we can rely on dividend income without having to sell our principal. This gives us a higher margin of safety when we are living off our dividend income. Furthermore, we plan to pass down our dividend portfolio to future generations, so principal preservation is always something in the back of our minds.
While almost all dividend growth investors/bloggers provide dividend income updates regularly, myself included, one of the biggest complaints many people have is that we do not share information on how our dividend portfolio is growing. Is the dividend portfolio keeping up pace with the broad market performance? After all, stock price appreciation and dividend income are both important and cannot be ignored. If a dividend portfolio is yielding at 5% but does not appreciate its value at all for 10 years, it’s not attractive at all. Meanwhile, if a dividend portfolio yields 4% and appreciates in value by 15% per year, that looks super attractive!
Therefore, I thought it would be interesting to investigate the growth of our dividend portfolio and benchmark against the TSX Composite Index. Has our dividend portfolio been beating the TSX
Dividend portfolio growth over the years
A word of caution, since I don’t blog anonymously anymore, for privacy reasons, I need to be careful with how much information I share. For this exercise, I won’t be sharing the yearly portfolio values and how much money we contributed to our dividend portfolio each year.
Mrs. T and I have been tracking our net worth for over 10 years every quarter (we grew 250% in 5 years). As part of our net worth tracking exercise, we also track our dividend portfolio. Separately, we also keep track of how much fresh capital we contribute to our dividend portfolio each year.
As you may recall, we had our financial epiphany in 2011 and got very serious about dividend growth investing in 2012.
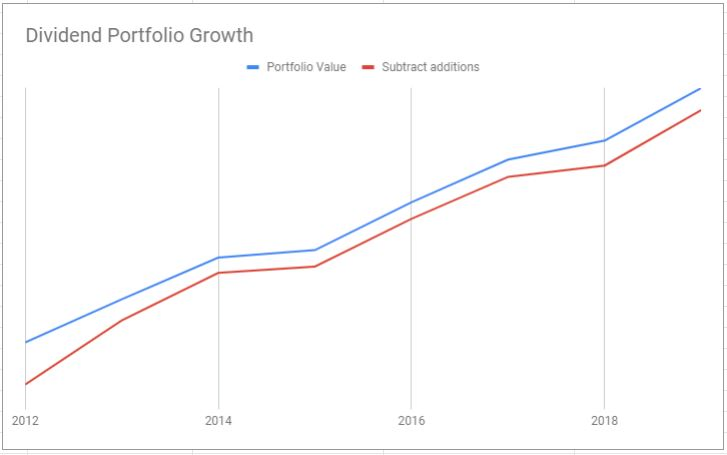
Below is the growth of our dividend portfolio over the last seven and a half years.

If we calculate the YoY growth it looks something like this:
| YoY Growth | |
| 2012 | 142.28% |
| 2013 | 64.15% |
| 2014 | 37.98% |
| 2015 | 4.86% |
| 2016 | 29.97% |
| 2017 | 20.61% |
| 2018 | 7.63% |
| 2019 | 19.52% |
Note: 1 For 2019, the portfolio value was taken on July 1, 2019.
Note 2: Portfolio value was recorded in CAD. Holdings in USD were converted to CAD at the time of portfolio recording.
How YoY growth was calculated:
Say at the beginning of 2012 the portfolio value was $10,000.
Then at the end of 2012, the portfolio value was $20,000.
Then 2012 YoY growth = (20,000-10,000) / 10,000 * 100 = 100%
YoY Growth Performance Analysis
We had some very big growth numbers over the years! One thing to keep in mind is that we have been contributing new capital to our dividend portfolio every single year. We do that by first maximizing our TFSA and RRSP contributions at the beginning of the year and using the money to purchase dividend paying stocks or index ETFs. Once our TFSA and RRSP are maximized, we contribute additional cash to our taxable accounts.
When we got serious with dividend growth investing in 2012, we moved a significant amount of cash from my work’s RRSP into my self-directed RRSP (in-kind transfer so there was no tax consequence). Since my work’s RRSP allows for a free in-kind transfer each year, I have been transferring my portion of the RRSP into my self-directed RRSP every year. Unfortunately, I can’t touch the company matched portion.
Removing annual cash contribution
What if we remove these annual cash contributions? What would our dividend portfolio growth look like?
For this calculation, I went in and subtracted our annual cash contributions from the end of the year portfolio values and plotted the following graph:
The revised YoY portfolio growth looks like this:
| Raw YoY Growth | Remove annual contributions | |
| 2012 | 142.28% | 8.67% |
| 2013 | 64.15% | 33.04% |
| 2014 | 37.98% | 24.08% |
| 2015 | 4.86% | -5.97% |
| 2016 | 29.97% | 19.62% |
| 2017 | 20.61% | 12.33% |
| 2018 | 7.63% | -2.38% |
| 2019 | 19.52% | 11.32% |
| Average | 40.88% | 12.59% |
Now, these YoY growth rates are looking more reasonable. From 2012 to mid-2019, our dividend portfolio had an average growth rate of 12.59%. Not too shabby.
How I calculated YoY growth without annual contribution:
Say beginning of 2012 the portfolio value was $10,000.
Then at the end of 2012, the portfolio value was $20,000. And throughout 2012 we contributed $8,000.
The 2012 YoY growth would then be: (20,000-8,000-10,000) / 10,000 * 100 = 20%.
Then say at the end of 2013 the portfolio value was $35,000 and throughout 2013 we contributed $10,000.
The 2013 YoY growth would be: (35,000-10,000-20,000) / 20,000 * 100 = 25%
How to get started with dividend growth investing
In case you’re wondering how to get started with dividend growth investing, look no further than these two articles:
One of the things that we do is owning shares of these best Canadian dividend stocks. By holding these dividend paying stocks in our portfolio, our portfolio has managed to beat the TSX over the last number of years as you can see from below.
Comparing YoY growth to TSX Performance
It’s great that our dividend portfolio had positive growth in six out of eight years. You are probably wondering, how does our dividend portfolio performance compare to the TSX Composite Index?
I thought you might ask, hence for the comparison below:
| Raw YoY Growth | TSX | Remove annual contributions | |
| 2012 | 142.28% | 4.00% | 8.67% |
| 2013 | 64.15% | 9.55% | 33.04% |
| 2014 | 37.98% | 7.42% | 24.08% |
| 2015 | 4.86% | -11.09% | -5.97% |
| 2016 | 29.97% | 17.51% | 19.62% |
| 2017 | 20.61% | 6.03% | 12.33% |
| 2018 | 7.63% | -11.64% | -2.38% |
| 2019 | 19.52% | 15.66% | 11.32% |
| Average | 40.88% | 4.68% | 12.59% |
TSX was growing by an average of 4.68% over the last seven years. Since the historical stock market rate of return is 8%, you can say that the TSX has performed poorly over the last number of years.
And for those of you that like a visual representation:
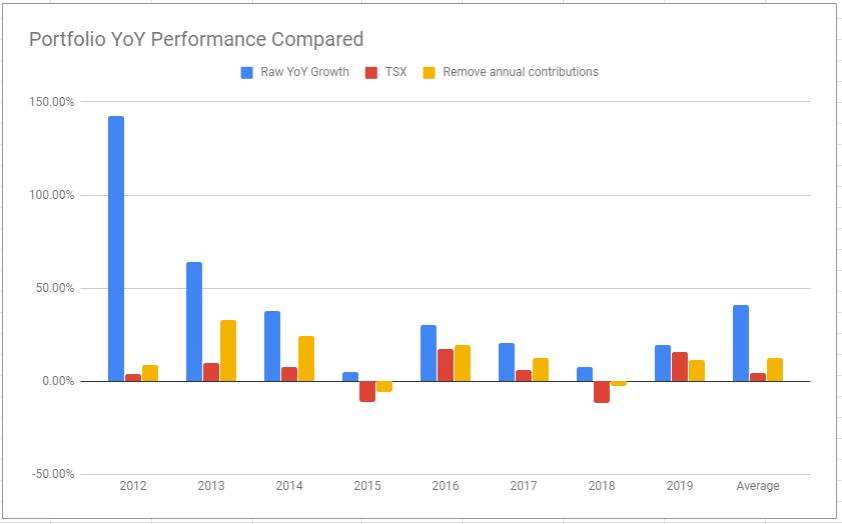
Dividend portfolio beating the TSX
When I ran this analysis, I thought it was quite interesting that we managed to outperform the TSX every single year since 2012, except for 2019. So far this year, we are over 4% behind when benchmarked against the TSX. Since there are still six months to go in 2019, I am not all that worried. Our poor performance this year probably has been mostly contributed by the stagnant price performance from Canadian stocks like Bank of Nova Scotia and CIBC. We also cleaned up our dividend portfolio recently by selling a number of underperforming stocks.
I’m not the next Warren Buffett. I was a little surprised that we managed to outperform the market. I do think we have been extremely lucky the last number of years. In addition, the calculation is not the most scientific since we are only subtracting the cash amount from the portfolio value at the end of the year. Obviously, whatever stocks we purchased with the new cash were growing and compounding throughout the year (I suppose it can go the opposite way too).
Considering the US market
One more thing to consider is that we own some US dividend paying stocks. US dividend paying stocks make up about 25% of our dividend portfolio (At 1:1.308 exchange rate). This is a simplistic view since I am not taking into account XAW at all. If we do a 25-75 performance mix between the TSX and the S&P 500 Index, then the overall broad market return looks like below, compared to our dividend portfolio’s YoY growth.
| Raw YoY Growth | TSX | DJI | 25% S&P500 / 75% TSX Mix | Remove annual contributions | |
| 2012 | 142.28% | 4.00% | 10.04% | 5.51% | 8.67% |
| 2013 | 64.15% | 9.55% | 29.41% | 14.52% | 33.04% |
| 2014 | 37.98% | 7.42% | 9.88% | 8.04% | 24.08% |
| 2015 | 4.86% | -11.09% | 0.10% | -8.29% | -5.97% |
| 2016 | 29.97% | 17.51% | 16.28% | 17.20% | 19.62% |
| 2017 | 20.61% | 6.03% | 27.97% | 11.52% | 12.33% |
| 2018 | 7.63% | -11.64% | -3.60% | -9.63% | -2.38% |
| 2019 | 19.52% | 15.66% | 19.34% | 16.58% | 11.32% |
| Average | 40.88% | 4.68% | 13.68% | 6.93% | 12.59% |
And the visual chart:
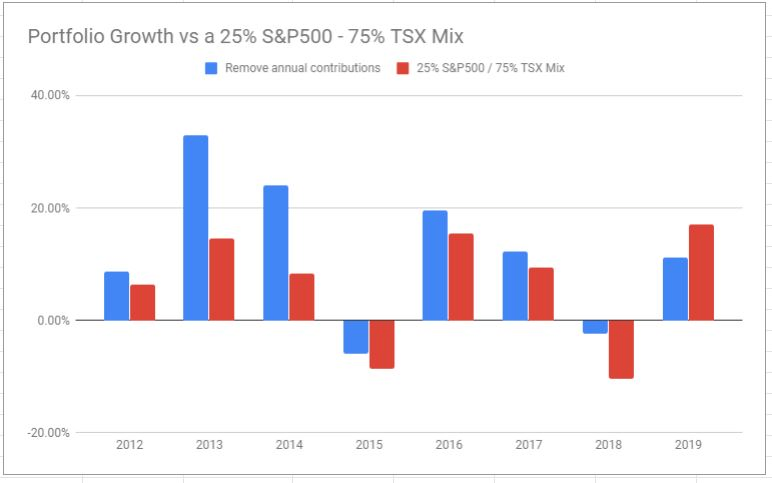
With the exception of 2019, we managed to beat the two broad market indices mix. Again, I don’t claim to be the next Warren Buffett, and I certainly am not.
Remember, I am not considering XAW asset breakdown (or VXC as we used to hold this international ETF until a few months ago) and its overall performance. It is simply too complicated to take XAW performance into account.
In case you forgot, although we own over 60 dividend stocks, we also own two index ETFs: Vanguard Canada All Cap (VCN.TO) and iShares All Country ex-Canada (XAW.TO). We are doing a hybrid approach to take full benefits of the best of dividend growth investing and index investing.
Final Thoughts
There you have it, our dividend portfolio growth over the last seven and a half years. The raw YoY growth numbers are very high, caused by mostly from the additional of new capital. If we remove the new capital contributions, we find that our portfolio has been growing, on average, 12.59% since 2012. This is better than the 25% S&P 500 and 75% TSX mix average performance of 6.93%. Given the YoY performance numbers, I feel that we have been very lucky and fortunate with our dividend-paying stock selections. However, this better-than-market-performance may or may not continue.
Therefore, I continue to believe in a hybrid approach of dividend growth investing and index ETF investing to get the best of the two worlds – predictable dividend income and diversification.
If you have any questions on dividend growth investing or index ETF investing, please take a look at the following two FAQs I have put together:
Happy investing everyone!
“Here’s a good question for you since you mentioned the lowest cost. If there’s a lower cost ETF than VTI and VCN, would you sell all of your shares and switch to the new ETF?”
If it had the same holdings, then yes I probably would. VTI and VCN are so low already that it would be hard to make it significant. There are also the transaction fees and buy/sell spreads that may factor in. Therefore, I might not necessarily sell + switch, but instead just start buying more of the new ETF.
Bernie — Congrats on your nice returns over the past few years. Are you are saying that you and other active investors can achieve superior results and beat the index over the long-term? Perhaps we should be buying Amazon stock instead, because it has returned > 30% per year over the same time period? 😉 I tend to think that people who think they can do a bit of research and beat the market are fooling themselves.
Thanks,
Mr Fundamental
Mr Fundamental,
Firstly, DGIs are not what I would call “active” investors. We’re more of a semi-passive long term buy and hold type of investor. Our holdings lean heavily towards mature blue chip steady eddies dividend growers spread across several sectors. I did extensive research when I was selecting candidates for my portfolio. These days I’m enjoying the fruits of my labour with income that easily suits my current needs and will likely meet my future needs via dividend growth.
Secondly, I don’t know why you bring up AMZN. Its a U.S. stock, I thought we were discussing Canadian stocks. I used to own more U.S. stocks. They did quite well for me over the years but when I converted to a RRIF in 2018 I decided to simplify my non-Canadian holdings to one U.S. stock (O) and one Int’l stock (UL). I still have a healthy portfolio content outside of Canada but its now mostly in ETFs. I’ve also added fixed income content to further dampen volatility.
Incidentally, I don’t own the stock AMZN and never have. I checked my ETFs and its not in their holdings either, not even in my U.S. Low Volatility ETF (SPLV). Congrats to you for owning a small piece of AMZN within your VTI. Don’t pat yourself on the back too hard though because there are also a lot of long term underachievers in that broad U.S. market ETF.
A lot of indexers foolishly assume DGIs are fooling themselves when they think they can beat the market. For your enlightenment DGIs are not dividend chasers nor is beating the market their primary objective. Their primary objective is to build an adequate income stream via a large diversified mix of quality stocks with reliable, predictable growing dividends. Total returns are secondary but, as studies have shown, generally do exceed market returns over the long haul if aristocrat content is high and dividends are reinvested. If you seek more info on DGI Tawcan’s blog is a very good source of info.
Happy investing to you. I hope you found an investing strategy that is right for you!
Hey Bernie,
I’m a believer in efficient market theory, and don’t believe that stock picking can ever outperform the index over the long-term. I would argue that the date range you’ve listed is somewhat “cherry-picked”, in that you are choosing JUST before the 2008 market crash as a starting point. 🙂 How does your comparison look if you start from December 2008? Maybe it is still good, but wouldn’t look nearly as favourable I’m guessing.
I’m not saying that doing DGI is a bad thing. I would just argue that it is NOT the way to maximize total returns over the long-term. For that, I’m a believer that going with the LOWEST cost index funds/etfs is the way to go. Of course, one still does have to choose an index. VTI is my favourite. As I mention, I put some in VCN as well in TFSA. If I lived in the USA, I think I would go with 100% VTI — easy.
Cheers, and thanks for responding/discussing with me.
Mr Fundamental
Here’s a good question for you since you mentioned the lowest cost. If there’s a lower cost ETF than VTI and VCN, would you sell all of your shares and switch to the new ETF?
Mr Fundamental,
I agree active stock picking has underperformed most broad indexes over the long term. The Canadian Index however, by nature of its sector imbalance, has been somewhat easier to top depending on ones investing strategy. I’ve been investing since 1984. I did ok with mutual funds I picked for the first 15 years then poorly with a full service financial advisor I employed from mid 1999 to mid 2008 before I went 100% DIY with DGI. Believe me, I have done much study over the years in the various investing strategies including indexing. Bottom line I’m performance driven. I’m OK with investing in broad indexes outside of Canada because they’re difficult to beat long term with an active approach. Personally I choose not to go the index route because I’ve been successful with my income focused semi-passive DGI course.
My performance data, which I reported above, wasn’t cherry picked. I was simply stating my long term total return numbers for the entire period I’ve been invested in DGI.
If you prefer to cherry pick by suggesting another period, ie; Dec 2008 to Aug 2019 I would be happy to share those results as well. My annualized total return over that period is 10.99% which still compared favourably with the 9.42% returned by XIC.
If we choose to compare the entire bull market period of Mar 2009 to Aug 2019 my annualized total return over the term was 12.98% vs 10.25% for XIC.
I would argue indexing is a simple way for most investors to get near market returns without the need to do much self research. For those inclined to a slightly more active strategy a dedicated DGI approach can lead to superior results, especially in the Canadian market.
Mr Fundamental,
I’ve been a dividend investor since 2008. Its served me well with growth and dividend growth. For the Jun 2008 to Aug 2019 period my predominantly Canadian dividend DGI portfolio annualized TOTAL return was 9.63%. XIC was 3.82% over the same term. Tawcan didn’t give his TR data but if he did and you poll others DGIs you will see most have overwhelmingly outperformed the Canadian Index in Total returns. The bonus is we also receive superior dividend growth when accumulating and/or income in retirement as I am benefitting.
I’ll redirect your question back to you: If TOTAL return matters more to you why are you you invested in the Canadian index rather than quality blue chip dividend growth stocks?
Hi Bob,
Nice post! I’m new to your blog, and it is nice to see a fellow Canadian finance blogger! I’m just starting out, so I’m hoping I can get some tips from you and others. I’m glad to see that your dividend picks are doing well. You’re approach of very few bonds and mainly stocks makes sense to me. I’m curious — why don’t you just invest purely in index funds/etfs, as opposed to focusing on dividend paying stocks? In my opinion, it is TOTAL return that matters. Whether that comes in the form of capital appreciation or dividend payments doesn’t really matter for RRSP/TFSA sheltered investments, does it?
I also like your philosophy of Canadian holdings inside of TFSA and foreign in RRSP due to the withholding tax. I mainly like VTI in RRSP and VCN in TFSAs.
Cheers,
Mr Fundamental
Thank you. We do both dividend and index due to have predictable income and geographical/sector diversification. I have an interest in stock analysis that’s another reason we invest in dividend income. Yes total returns matter and as I’ve shown here, we’ve done OK the latest few years.
Hi Bob,
Its great to see you are showing a more realistic way to display YOY growth, ie; YOY growth (with annual contributions removed). I’ve been using the same simple calculation for my returns for close to 20 years. We all know unadjusted returns are mostly dictated by new money added in so your new approach is more accurate. I’m in retirement now and living on some of my income while not adding in any new money so my YOY% calculation has been adjusted to {[Year end balance – (Year end balance + income removed)] / Year beginning balance}*100%.
Just curious why you use DJI for your S&P500 proxy? The Dow Jones Index, or DJI, only contains 30 U.S. companies vs the S&P500 Index’s 500 companies. Also what is odd about the DJI is that it is weighted by stock price rather than market cap. A more accurate comparison would be to use actual ETFs because your actual portfolio balances are post fees and ETF performances are also post fees. Good comparatives would be XIU to represent the TSX60 and XUS to represent the S&P500, if you keep your portfolio U.S. content in $USD. If your portfolio U.S. content is kept in $CAD a better comparative ETF would be XSP.
Congrats on your success. 10+% returns are absolutely excellent but what’s even better is that you are benefiting from compound interest. You’ll experience those gains well into the future too. Warren Buffett made most of his wealth after age 60 so the future looks bright for your family.
Tahnk you investortrip.
Be careful using an (arithmetic) “average” of a performance, since it makes no sense when thinking with compounding (what’s a major argument for FIRE investors). I give you an example:
one year you make +50% (factor 1.50, used later), next year you make -50% (factor 0.50).
The (arithmetic) average would be 0% (factor 1, which means you have the same amount as in the beginning.)
But when compounding, this is false. you have 1.50*0.5=0.75 (0.75 of what you had in the beginning), equals -25%.
Broken down to one year, you get a geometric average of sqrt(0.75) = 0.75^(1/2) = approx. 0.866 which means you need to make -13.4% (compounding incl.) to get -25% at the end of year 2.
So your geometric average will be approx +11.9% :
(1,0867 * 1,3304 * 1,2408 * 0,9403 * 1,1962 * 1,1233 * 0,9762 * 1,1132)^(1/8) = approx 1,119
Good point, I took a simplistic calculation approach, thanks for pointing this out. +11.9% seems pretty good in my view. 🙂
Of course, it’s a fantastic result! I wanted to explain the difference between arithmetic and geometric averages because you mentioned Buffet and if someone compares the results from the blog to those of external sources, which are normally indicated as geometric averages, then he may get a wrong picture.
Wow fantastic growth over the years and beating the TSX!! My YTD return is not so hot this year compared to yours, but it’s still not bad!
Thanks GYM. The YTD return has dropped a bit due to the recent market volatility that’s for sure.
While there is definitely Net Total Return (NTR) numbers available (though hard to find) for the TSX composite, I don’t believe they are what you’ve quoted.
Have a look at http://siblisresearch.com/data/tsx-composite-return-dividend/
I actually gave up trying to find a good reliable and frequently updated total return tracking for the TSX composite and instead use the XIC ETF as a proxy for this. It should only vary by the 0.11% fee and any tracking deficiencies.
If you have a good source for total return tracking for the TSX composite I’d like to know about it. Also, happy to be proven wrong here. 🙂 and I have enjoyed your blog, thanks.
Thank you Robin.
Apart from the contribution issues, aren’t you comparing your performance including dividends to the TSX composite without dividends?
The TSX composite performance is including dividends & distributions too. 🙂
Nice Bob
Congrats on all your success. This is something I should do from time to time. I need to start keeping track of my portfolio balance every year end. I tend to just focus on the income it generates and just watch the overall portfolio value go up.
I definitely have had some losers, but have learn t to stick to the blue chips. Although I still hold some fat that needs to be cut in that regard =)
Anyways keep it up man, great to see
cheers
Thanks man. It’s a good idea to track your portfolio value to make sure you are at least keeping up with the market performance.
Thanks for sharing, interesting analysis and I like to see the benchmark comparison! Keep that snowball rolling!
My wife (Canadian) applied for US citizenship last week! You are one of the few Canadian based blogs I follow so I thought I would share!
Take care,
Max
Thank you Max, appreciate it.
Hi Bob,
Where do you hold your two index ETF’s? TFSA? RRSP?
Appreciate the feedback and always look forward to reading your material
Garrett
We hold VCN in both TFSA and RRSP. For XAW we hold it in RRSP only.
Why XAW only in RRSP and not TFSA?
Because in TFSA we’d get hit by the 15% withholding tax.
I think you might have a flaw in your formula. While you subtract your annual contributions made at the beginning of the year, you have left the income that those contributions earn in your results, which makes your results seem higher than they should be. I have struggled with the same calculation through the years and have decided not to do that calculation as it is too time-consuming and I have better things to do with that time.
Thank you for the info contained in your blog posts. I really enjoy them. I also like your approach to life.
Hey Jan,
Yes good point and I did point this “flaw” in the post. I have left the income that those contributions earn in my results. In years that have good returns, it’s compounded. But in years that have bad returns, that’s also compounded too. So in bad years, that should have made the returns much worse but somehow, that didn’t happen. 🙂
Hey! Thanks for sharing this detailed analysis.
Few observations:
– Your average yearly rate of return is 12.59% per year since 2012, which is phenomenal!
– I notice that you do not have bonds, but if you were to simply buy a total US index (say, TD 902 US via e-series mutual funds), your average return from 2012 to 2018 would be: 17.24%.
– Let’s say you want to diversify by adding CAD Index (via TD 900 CAD e-series mutual funds), your average per year then is 11.58%
– Let’s say you want to further diversify by adding International Index (via TD 911 Int’l e-series mutual funds), your return then is 11.24% per year.
– TD e-series mutual funds do not cost anything to buy/sell/switch and the annual return I posted above is net of fees.
Clearly, you are indeed beating the average return!
However, how much extra time have you done in buying/selling? If your time is worth $40 an hour, how much $$ has gone through this exercise? If you were to add this cost in, how does your yearly return change? What about the cost of buying shares?
Your return may not be as high as you think if you factor in these two costs.
Thanks for sharing!
Hey R,
Thank you, I was surprised too!
We have bonds in my work’s RRSP which I did not include in our dividend portfolio calculation. We have very little bonds though.
I actually haven’t been spending that much time buying and selling lately. Maybe 30 minutes here and there every other month?
Fair enough. And I’m sure that spending a bit of time on buying shares can be fun, as you do your research!
But how much are you spending in transaction costs? That needs to be factored in as well. It may be insignificant on a relative basis but it can indeed add up on an absolute basis.
hey bob. those calculations really are a pain in the neck where you back out contributions. i’m about to make a portfolio for a new investor on the blog that would mimic regular contributions like a person starting out might do. my plan is to “buy” an equal dollar amount of the sp500 and the qqq (nasdaq 100, my favored index) along with a monthly stock pick. i don’t even have complete contribution records going back more than a couple of years and with 4-5 different brokerage accounts the time to look all that up is too much to bear. i hope the malevolent missy portfolio is easier to track with the blog in mind for performance comparison.
i’m glad you culled some losers. that opportunity cost is real and so is the share appreciation factor. i think you’ll continue to beat the TSX by avoiding too many crappy names. nice post.
Hi Freddy,
Yes it was difficult to calculate the returns but it was definitely a worthwhile exercise. 🙂