
Ok, I know what you’re thinking and wondering… you saw the $71,852.02 CAD ($57,434.75 USD) total expenses for 2021 and you’re probably wondering what kind of extravagant lifestyle did we have last year in the midst of a pandemic?
And I’ve been blogging about being frugal and increasing the savings rate gap?
Am I some sort of liar and are my pants are on fire?
Don’t worry, I’ll answer all of those questions shortly.
Although I don’t share our dividend portfolio value, I have been publishing annual financial reviews for the past five years to analyze how the previous year went. I have found these annual reviews very useful because they keep us accountable and help us to understand where we are on our financial independence journey.

Most importantly, I believe these annual financial reviews will provide readers with ideas on what it is like for a family with two young kids living in one of the most expensive cities in the world. I want to show how we navigate through our financial independence journey and how we plan to live off dividends when we are financially independent.
2021 was unlike other years. I worked from home the entire year, we didn’t travel anywhere outside of BC, and our expenses were anything but normal.
Our Budget System
Let me remind the budget system we use. We have been using our current budget system since mid-2011. Each month we break down our after-tax income into 6 different accounts and allocate a certain percentage for each account.
Here’s the default suggested percentage breakdown for each account:
- Necessities/Core Expenses (55%)
- Education (10%)
- Play (10%)
- Financial Freedom Account (10%)
- Long Term Savings for Spending (10%)
- Give (5%)
We have adjusted these percentages accordingly each year after reviewing our spending trends. Currently we allocate less than 50% for the necessities account.

In each account, we also have different categories to track the different expenses. For example, for necessities, we have categories like groceries, household items, internet & cellphone, and clothes.
Tracking everything in our budget spreadsheet has allowed us to create spending trends visually so we can analyze and figure out if there is anything we need to improve on.
2021 Spending: $71,852.02 CAD / $57,434.75 USD
In 2021 we spent a total of $71,852.02 CAD or $57,434.75 USD. This has been the highest annual spending amount since we started tracking our expenses in 2011.
Please note, the amount mentioned does not include any businesses expenses. Mrs. T and I have a few side businesses and they cost money to run. For example, running a blog isn’t free. There are expenses like hosting fees with Bigscoots, newsletter service with Mailerlite, and premium WordPress plugins like WP Rocket. Mrs. T also has business expenses for her holistic doula services.
Here’s our annual spending since 2012:
| Total Necessities | Necessities per month | Total Annual Spending | Total Spending per month | |
| 2012 | $26,210.52 | $2,184.21 | $44,603.76 | $3,716.98 |
| 2013 | $26,343.00 | $2,195.25 | $45,260.88 | $3,771.74 |
| 2014 | $29,058.96 | $2,421.58 | $47,391.96 | $3,949.33 |
| 2015 | $31,256.88 | $2,604.74 | $47,270.16 | $3,939.18 |
| 2016 | $29,831.40 | $2,485.95 | $47,566.96 | $3,963.91 |
| 2017 | $33,887.68 | $2,823.97 | $51,144.77 | $4,262.06 |
| 2018 | $31,840.75 | $2,653.40 | $57,231.99 | $4,769.33 |
| 2019 | $33,199.98 | $2,766.66 | $54,906.02 | $4,575.50 |
| 2020 | $35,511.60 | $2,792.33 | $48,908.74 | $4,075.73 |
| 2021 | $38,950.66 | $3,245.89 | $71,852.02 | $5,987.67 |
As you can see, 2021 was a very expensive year compared to the previous years. Both necessities and total annual spending jumped up significantly.
If we calculate the annual spending on a per person basis, it means the four of us spent just under $18,000 CAD or a little under $14,500 USD per person. It’s a little high in my opinion.
Before 2021, our highest spending year was 2018 when we spent $57,231.99. So what made 2021 so expensive?
First of all, we spent around $1,000 of vet bills when our cat Perlemus got sick last summer. Then in early December, we found that she was limping around. Unfortunately her mobility deteriorated quickly and we were forced to put her down just before Christmas. All the vet bills for Perlemus added up to almost $1,500. Furthermore, we had to spend over $15,000 on house maintenance last year. We hired someone to clean the roof (much needed). After the major rainstorms in November, we discovered that our house’s hidden gutter system needed to be repaired. The gutter crew of five spent a week adding drain holes, enlarging existing drain holes, repairing seams, etc.
In other words, we had large unplanned spending of around $16,500 in 2021.
If we took out the $16,500 from our total, it’d normalize our 2021 annual spending to about $55,000 CAD or $44,000 USD. $55k CAD is roughly in line with other years but it is still one of the more expensive years.
However, we need to remember that 2021 was a difficult year for many of us. The pandemic created a lot of mental strains, us included. We ordered more takeouts throughout 2021 so we didn’t have to think about what to cook for dinner. This increased our Play spending quite a bit. The sharp increase in food prices resulted in us spending more on groceries throughout 2021.
Deep Dive into the 2021 Numbers
Let’s take a closer look at the 2021 numbers.
- We spent $5,987.67 CAD per month. We decided to categorize the house mainenance cost under LTSS rather than necessities. If we exclude the veterinarian and house maintenance expenses, it would put us at around $4,580 CAD per month
- We spent $3,245.89 CAD per month in core expenses. The veterinarian expenses were categorized under core expenses (Perlemus was an important member of the family!). If we take out the veterinarian expenses (~$1,500) it would bring down our per month necessities spending to $3,120.89.
- We continued to change our eating habits throughout 2021. First, we gave up milk completely and drank plant based milk only. Rather than making our own oat milk we went with the convinience route and purchased oat milk from grocery stores. We reduced meat consumption, ate mostly organic products, and ate produce from our own garden as much as we could. Both kids have been eating progressively more. As a result, we spent $1,178.14 on groceries per month. That corresponded to $294.54 per person each month or about $3.23 per meal per person. I’d be the first one to admit this was much higher than I expected. However, over the last number of years, we have put more and more emphasis and priority on buying high quality foods. Just like high performance cars require high octane fuel, we need to give our body good fuel to stay healthy. Sure, it would be nice to reduce our food spending a little bit but am I going to lose sleep over it..

- We spent $98.33 per month on gas which was slighlyt more than 2020. Since I worked from home all throughout 2021, we didn’t do nearly as much driving as pre-pandemic.
- We spent $102.38 per month on clothes and shoes. We had to buy both kids a few new pairs of rainboots and shoes throughout the year.
- We spent about $20 more per month on natural gas and hydro but our usage was roughly the same as 2020. This was mostly caused by an increase in price for natural gas and hydro.
- Despite not eating out at restaurants as much due to the pandemic, we ordered more takeouts than other years. Mentally, it was hard to get through 2021. To keep ourselves sane, it was often easier to order takeouts. We spent $330.91 per month on dining out/takeouts.

- On average, we spent $4.13 per person per meal in 2021.
- We donated 20% more to charities than 2020. We are doing well financially so we believe it is vital for us to help those in need.
- We saw a moderate increase of $400 for property tax and house insurance. We are expecting both to increase this year…
| Total Spending | Necessities | Groceries | Car Gas | Clothes & Shoes | Dining out | |
| 2016 | $3,963.91 | $2,485.95 | $662.61 | $115.33 | $108.51 | $392.17 |
| 2017 | $4,262.06 | $2,823.97 | $784.07 | $123.57 | $86.27 | $370.13 |
| 2018 | $4,769.33 | $2,653.40 | $714.98 | $140.85 | $105.39 | $432.80 |
| 2019 | $4,575.50 | $2,766.66 | $747.94 | $148.20 | $99.98 | $455.95 |
| 2020 | $4,075.73 | $2,792.33 | $870.17 | $93.31 | $62.14 | $178.88 |
| 2021 | $5,987.67 | $3,245.89 | $1,178.14 | $98.33 | $102.38 | $330.91 |
Other than the unplanned large expenses mentioned already, most of the spending increases came from expenses like groceries, dining out, charitable donations, utilities, property tax, and insurance.
2021 Net Worth: +34.4%
Because my name is associated with this blog, for privacy reasons, I don’t publish our actual net worth numbers. Instead, I only share net worth changes in percentages.
Last year both the stock market and the housing market went for an amazing run. Thanks to the hot market, we saw an increase of 34.4% in our net worth!
For simplicity’s sake, we don’t include depreciation assets like the family car and photography gear in the net worth calculation. Essentially, our net worth consists of our cash in our chequing and savings accounts, investments in taxable accounts, RRSPs, TFSAs, and RESPs, and our house then minus any debt we have. We use the annual BC Assessment value for our house value.
I have been using Wealthica to periodically monitor our liquid portfolio value. I think Wealthica is a great tool to track investment breakdowns and performance. Wealthica is also great if you don’t want to bother with a big Excel spreadsheet. For tracking our net worth, we use the good old Excel spreadsheet.
Growing our net worth
How do we grow our net worth? As you can see from the chart below, our liquid net worth (cash + investments) has grown pretty consistently over the last 13 years.
So what’s our secret?
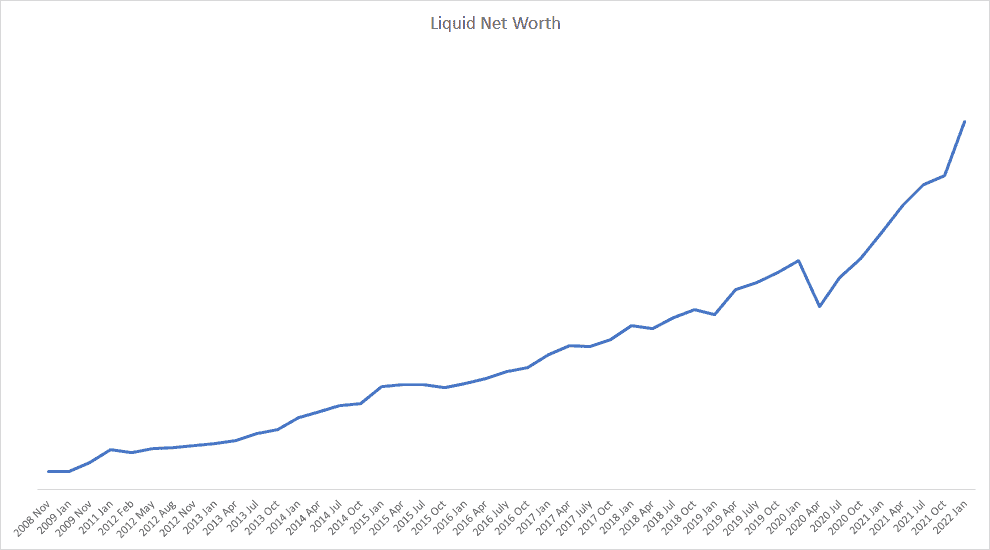
You might be surprised that we don’t have any secrets on how to grow our net worth. It comes down to increasing our earning and spending gap (i.e. savings rate) and investing the money saved in appreciating assets like dividend paying stocks.
That’s it. It’s pretty simple.
Do you want more specifics?
- We maximize our RRSPs every year.
- We maximize our TFSAs every year.
- We maximize kids’ RESPs every year.
- We try to invest as much money as possible in taxable accounts once we maximize tax-advantaged accounts.
- We DRIP our dividend income whenever we can.
- We re-invest 100% of our dividend income.
- We try to ruthlessly cut expenses on things that we don’t enjoy spending money on.
- We spend money on things that we enjoy. Like food and travel.
- Most importantly, we invest for the long term by ignoring the short-term noises. We hold onto our investments unless the fundamentals of the company have changed.
- We remind ourselves that time in the market is far more important than timing the market.
Rinse and repeat for years and let the power of compound interest take over.
Random Numbers from 2021
Enough seriousness, let’s look at some random and possibly fun numbers from 2021.
Travels
- Total business trips: 0! A big change from other years.
- Total flights taken: 0! Another big change from other years.
Big fat zeros when it comes to travels. This shouldn’t come as a surprise given the COVID-19 pandemic.
Personal
- Total number of times I worked out: 213
- Total books read: 17
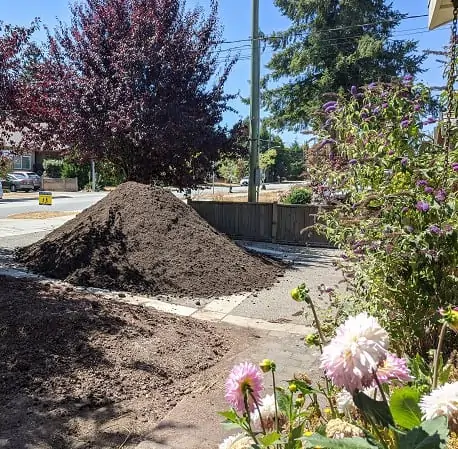
- Amount of dirt/manure shovelled: 13 yards
- Number of camping trips: 3. A total of 9 nights
Here are some workout videos I made so I can review my techniques.
View this post on Instagram
View this post on Instagram
View this post on Instagram
We did a lot of yard work throughout 2021 and I was the muscle for moving all the dirt around (13 yards!). Maybe that should be my next side hustle… not!
Blog
- Top visiting country: Canada eh (76.72%)
- Top three visiting provinces: Ontario (46.78%), BC (20.54%), Alberta (12.47%)
- Pageview: 928,765 (thank you!!!)
- My favourite posts from 2021:
- Hardest post to write in 2021:
Thank you to all the readers for your support throughout 2021. I really appreciate it!

Passive Income
In 2021 we received $30,912.20 in dividend income. This amount covered 79.4% of our necessities/core spending and 43% of our total spending.
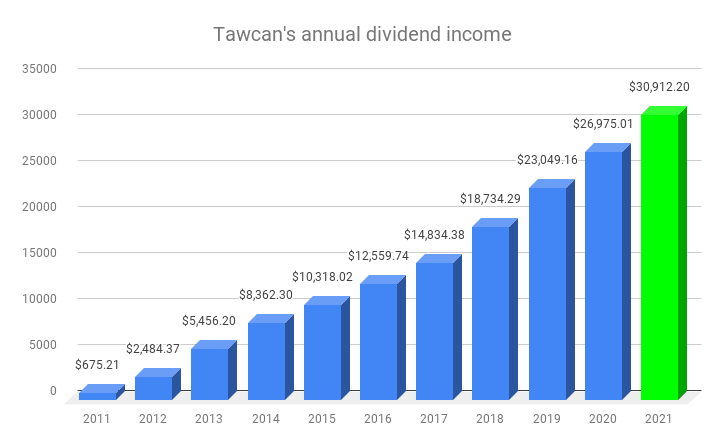
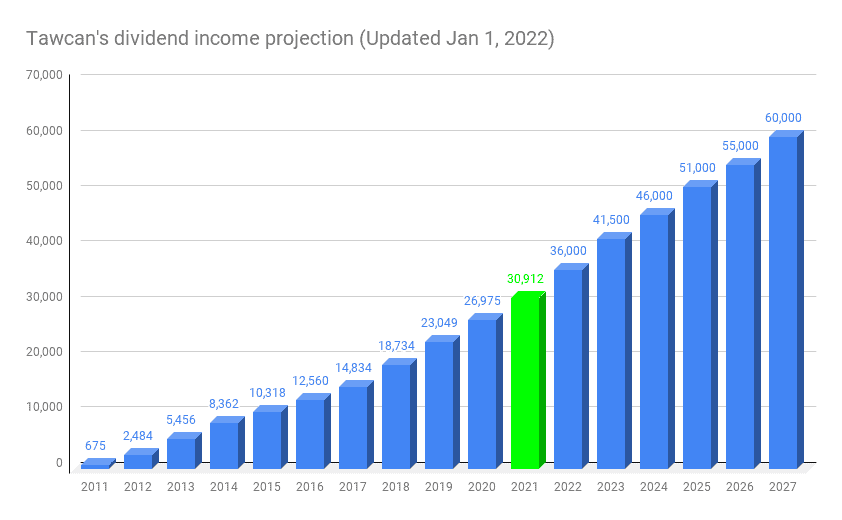
We are getting closer and closer to having dividend income covering 100% of our core expenses! Based on my own dividend income projection, our goal of becoming financially independent via dividend income by 2025 is still on track.
We continued to strategically apply for rewards credit cards to earn passive income throughout 2021. We earned 130,000 Aeroplan points by applying for a couple of Aeroplan credit cards. At a value of 2.1 cents CAD per point, that means we earned $2,730. We also switched from RBC Avion Visa to WestJet World Elite MasterCard and earned $500 worth of WestJet points.
By applying for the Mariott Bonvoy American Express cards, we earned 135,000 Marriott Bonvoy points. At 0.9 cents CAD per point valuation, that means we earned $1,215 for future hotel stays.
In total, we earned ourselves an additional $4,445 via applying for credit cards and earning welcome points. The key is to pay off the balance each month. These hotel and travel points will come in very handle once we can travel internationally freely again.
We also earned travel points through our HSBC World Elite MasterCard and interest for having cash in high savings accounts. But I didn’t track these too closely.
2021 Financial Review Summary
In 2021 we spent much more money than anticipated, mostly caused by a few unexpected big expenses. Many day-to-day expenses also increased because of inflation. It is our goal to normalize our expenses in 2022 but we are facing a lot of headwinds due to the high inflation rate.
Our net worth increased significantly thanks to the hot stock and housing markets. Will we see another fantastic year of return in 2022? I have no idea and I will not worry about things that are outside of our control. What I know is that we will continue earning money, saving money, and investing the money saved in appreciating assets.
Here’s to a fantastic 2022.
Stumbled upon this review today and I think it’s such a great idea that you’re using your website once a year to post and archive this progress for yourself and everyone who follows you. I might have to start doing the same in January 2023 😉
Congrats on being able to achieve this living in Vancouver, it’s crazy over here in Toronto, but I think it’s a bit worse there. Cheers to more growth year after year my fellow Canadian!
Thanks Passive Canuck. I’d love to see your 2022 numbers next year. 🙂
I’d love to see a vancouver area frugal gardening post!
Thanks Alex for the idea. Will see what I can come up with (need Mrs. T’s help).
Thank you for the detailed analysis and numbers as always.
Our biggest spending in 2021 was our travels which costs us $20K in total. I don’t really calculate our spending or savings rate as I don’t see the value for me personally but I am sure we didn’t spend more than $30K after deducting the traveling.
That’s amazing you travelled so much in 2021.
With the continuing intense weather systems induced by climate change I think investing into any form of water mitigation when it comes to your house is the wisest investment decision you can make. I did new downspouts this year myself.
Hope 2022 is a great year for you and the family. For everyone struggling out there I really hope our assessments in BC don’t have a huge jump like they did this year.
Housing assessments in BC have been insane the last few years. The market doesn’t seem to be cooling down either.
great stuff Bob.
Do you track all your expenses monthly or look it all over at year end?
I stopped budgeting or looking at our expenses as long as we continue to save. But recently thought it may be good to track one month just to see how out of wack things are.
love all the credit card hacks, that’s something I should really look into.
great blog stats!
keep it up
Hi Rob,
We track all of our expenses monthly then review them every half year and see what we can adjust.
thank you for this article. I am enjoying your blogs. Quick question: Is $20 for natural gas and hydro normal in BC? I am in Alberta, and it seems very low to me. Thanks.
Thanks. I think you read it wrong. I mentioned it was $20 more compared to 2020. In my previous point I stated that we spent $98.33 per month on gas.
Hey Erhan, I live on Vancouver Island and my entire house is electric with no natural gas. I use an electric hot water heater and my heating/cooling is via a Heat Pump. I deal only with BC Hydro and have 4 adults in my house for power consumption, this works out to $119/month as my total household utility bill.
This is a great motivation for me!
Glad to have provided some motiviation. 🙂
Yes DIY around the house saves tons of cash. Advice is free by YouTubing!
Done many things like roof moss- just install zinc strips at apex, sprinkling zinc sulphite powder every year .
Do my own light switch , lighting thermostat installation.
Sump pump maintenance and replacement easy.
Replace holes in drywall , floor repair.
Appreciate the slinging around yards of soil and gravel.
Yard drainage with installing own French drain easy.
Root damage to driveway and yearly driveway costing easy. Rebuilt block wall.
I’ve saved $thousands a year by YouTube and DIY over quotes from contractors.
I’m up to $90K in passive income too.
Yes we do a lot of DIY around the house too. Since we don’t want to climb around the roof (especially on the higher level) is something I want to do myself, we want to leave it to the professionals.
Congrats!
Your newsletter is always a good source of motivation for me.
Thank you Pierre, I appreciate your kind words.
Wow. Congrats on the net worth growth Bob. Looks like you’ve recovered very well from the 2020 lows.
~$72,000 in spending is pretty decent. And I’m pretty sure it will be lower this year because you’re not likely to have another $16,500 in unexpected costs.
For reference in 2021 my wife and I spent over $100,000 in total. We like to treat ourselves often, haha.
Thanks Liquid. We had a very low annual amount in 2020 so over the long term everything eventually balances out.
Nothing wrong with treating yourselves often. 🙂
Congratulations Bob.
I’m not sure if I missed this. In approximate %age how much of your expenses goes towards rent (if applicable) or mortgage payment ? I believe this would be the major necessity expense head for most people and other major one would be Food/Grocery and Car expenses. In my view there is very little legroom for one cut down on rent or food, while others can be managed or controlled to an extent.
Thanks Sridhar. We didn’t mention the mortgage payment amount for privacy reasons. You’re right though, food/grocery and ren/mortgage expenses are often outside of one’s control.