I am an Excel spreasheet nerd. So when the great J. Money shared a couple spreadsheets for calculating when you can achieve early retirement / financial freedom, I decided to create my own early retirement financial independence spreadsheet calculator to incorporate dividend investing as well as other passive income streams. (I like using the word independence instead of freedom cuz I’m no William Wallace 😉 ). According to our somewhat conservative calculation, we should be able to achieve financial independence in about 15 years. Our financial independence timeline will be reduced to about 10 years if we are more aggressive with some of the calculations and assumptions. The 10 – 15 year time frame is approximately on par with our target. Since this is just a forecast, there are many variables that may change to alter the end result. For now, we’ll continue being frugal and invest as much money in our dividend portfolio as possible.
J. Money’s spreadsheets assumed that you will be withdrawing from your retirement/investment funds at a certain rate. This is perhaps different than the concept of dividend investing. For dividend growth investors, we are buying dividend paying stocks with the goal that one day our monthly dividend income will be greater or equal to our monthly expenses. When this happens, we can then call ourselves “financial independent” and can quit our jobs if we choose to. For dividend growth investors, the goal is to not touch the principal and only use the dividend payouts to cover all the expenses.
The Early Retirement Financial Independence Spreadsheet Calculator
Here are some explanations for my version of the early retirement financial independence spreadsheet:
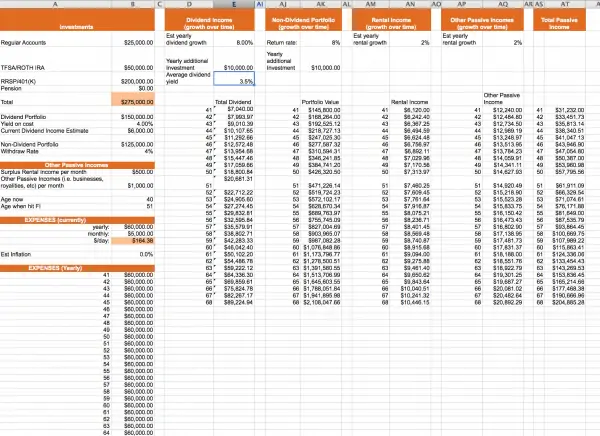
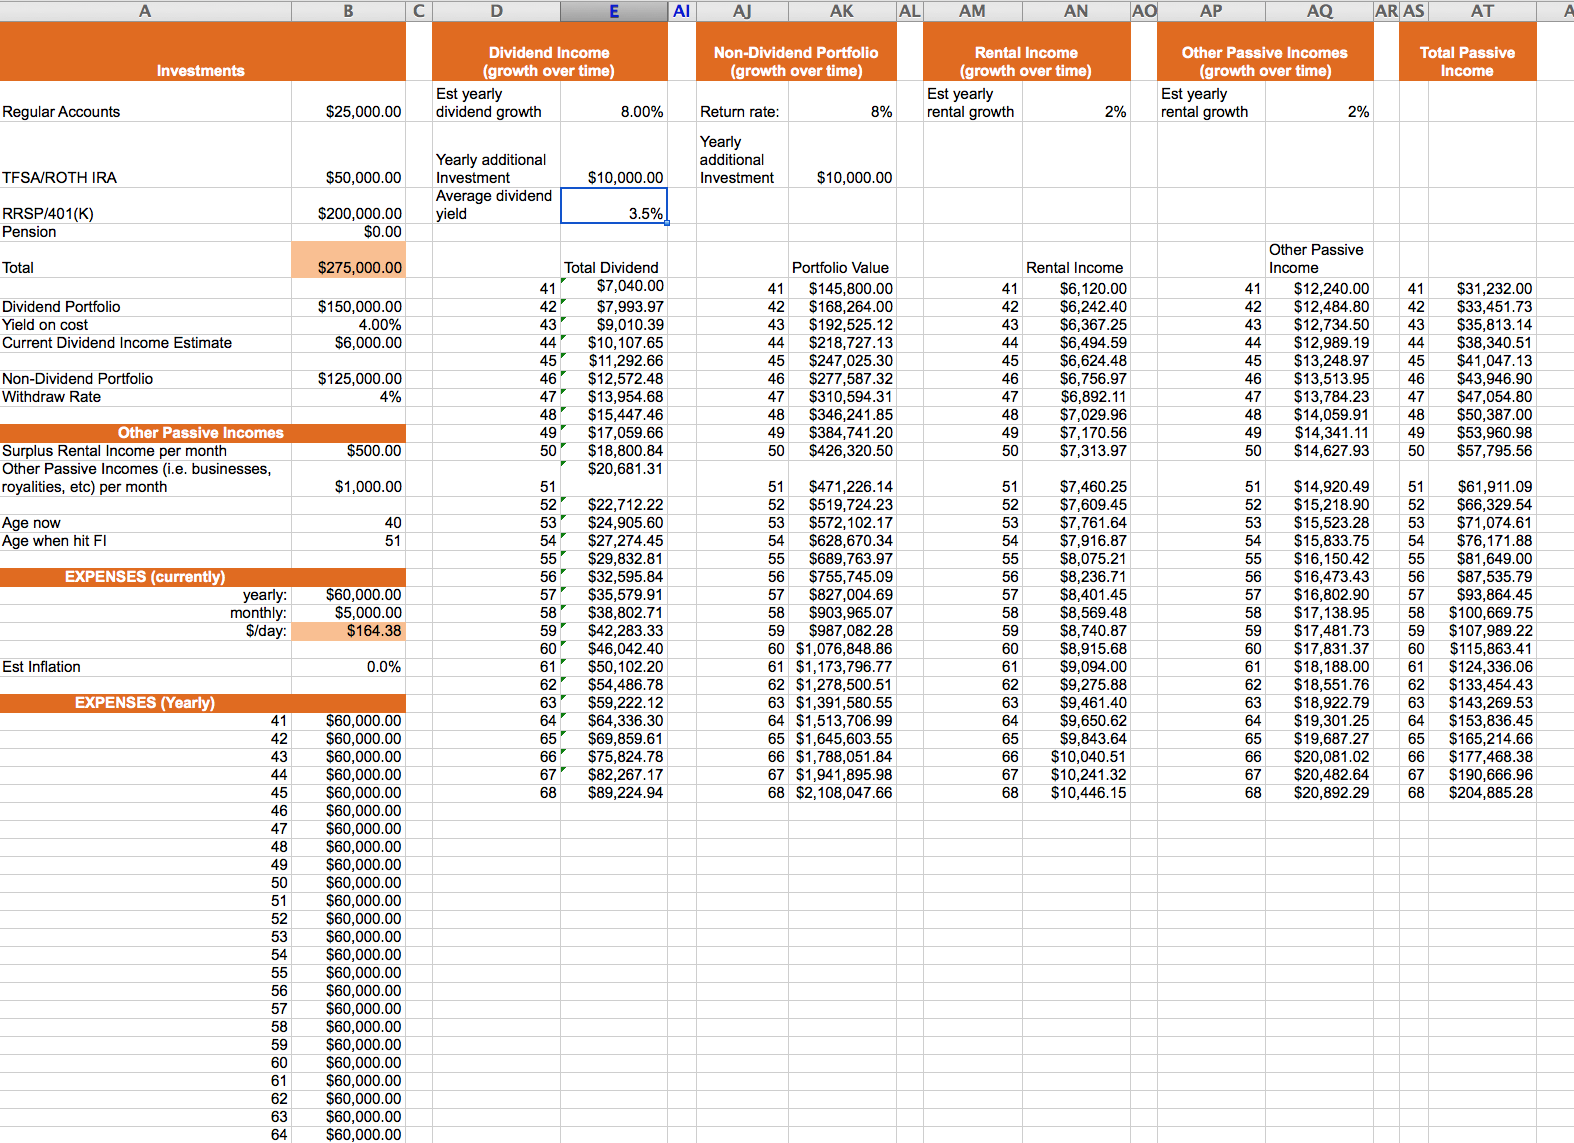
Investments
This is where you list all of your investments. I used J. Money’s original format but added Canadian touches by including RRSP and TFSA. To incorporate dividend investment concept, the total investment portfolio is split up into two – dividend portfolio and non-dividend portfolio. For the dividend portfolio portion, you will need to enter your portfolio’s yield on cost percentage. This will then determine your current forward dividend income. The non-dividend portfolio value is therefore whatever amount left. We will withdraw money from the non-dividend portfolio.
Other Passive Incomes
Since some people not only invest in stocks but also invest in real estates, royalties, businesses, and other passive income generating revenues, this section is used to track these incomes. I broke this section into two, one for tracking real estate income, the other for tracking other passive incomes. Since I’m no real estate expert, the rental income section is extremely simplified. I am simply using monthly rental surplus as the calculation variable.
Age:
Here you enter your current age. The spreadsheet then takes in all the parameters that you have entered to determine the age that you will achieve FI. This is determined when your total passive income is greater or equal to your yearly expenses. If the spreadsheet gives you a “False” result, I’m sorry to say this but you are in serious trouble. Time to shape up!
Expenses (currently) –
This section is pretty self-explainatory. In order to determine when you can achieve financial independence, we need to estimate your monthly expenses. The yearly expenses is derived by multiply the monthly expenses by 12. You can just plug in a rough number here or use the “Expenses” sheet to estimate your monthly expenses. To help determining a more accurate monthly number, I have listed different possible spending categories for you to enter. Depending on your personal situation, you may have more categories, feel free to modify this section as you wish.
In the perfect world, the monthly expenses will stay the same forever, however, this is typically not the case due to inflation. Even if you keep all the expenses in check, some expenses like property taxes and car insurance will most likely increase every year. In the spreadsheet, I have included a section for estimating the inflation rate and how it will impact your future yearly expenses. If you think you can keep the monthly expenses the same over the next 20 to 30 years, simply use 0% as the inflation rate. I think it’s reasonable to assume a 0.5% – 2% yearly inflation rate on your annual expenses.
Dividend Income (growth over time) –
This is where we calculate your future dividend income. First we need to have an estimate on the yearly dividend growth rate. To determine this parameter, you can take a look at your dividend portfolio and calculate how much your dividend income is growing each year if you don’t contribute any additional capital. This is also known as the organic dividend growth rate. Next enter the additional money that you plan to add each year and estimate the average dividend yield for the dividend stocks that you will purchase. There are a lot of numbers to enter in this section and a lot of assumptions that we’re making. Do you best. I think it’s reasonable and conservative to assume that the new stock purchases will yield anywhere between 2.5% to 3%. A dividend growth rate between 5 – 10% is also pretty reasonable I think.
Non-dividend Portfolio (growth over time) –
Similar to the previous section, this is where you determine how much growth you will see on the non-dividend portfolio over time. The return rate and yearly additional investment will determine how fast your non-dividend portfolio will grow.
Rental Income / Other Passive incomes (growth over time) –
Shame idea as the previous sections. We need to estimate how much rental income and other passive incomes will grow over time.
Assumptions the early retirement financial independence spreadsheet makes:
- 4% withdraw rate – For the non-dividend portfolio we assume a withdraw rate of 4%. This seems to be the universally agreed withdraw rate. You can change this number based on your belief and comfort level.
- 8% growth rate for non-dividend portfolio – We assume that the value of the non-dividend portfolio will grow at 8% annually. This is to be in-line with what J. Money used in his original spreadsheets. If you feel like you can achieve Warren Buffet like return, feel free to change this number.
- 8% dividend growth rate and 3.5% new stock dividend yield – these are the conservative estimates I’m using. If you decide to invest in higher dividend growth stocks and/or take on more risks these numbers will be very different. Change them as you like.
- Dividend re-investment – For the dividend portfolio, we assume that you will re-invest all the dividends received each year. If you want to see all the background calculations you can unhide the columns. I assume that you’re not enrolled in dividend re-investment plans (DRIP) and re-invest all the dividends and the new contributions at the same time. To be perfectly honest, I wanted to calculate the affect of DRIP but the calculations are just too complicated. 🙂
- Total passive income – we assume that you will achieve FI when your total passive income is greater or equal to your yearly expenses. However we do not consider that your non-dividend portfolio value may start decreasing each year as you start withdrawing 4% from this portfolio. Again the math is a little too complicated to incorporate this factor into the spreadsheet.
- Yearly additional investments – we assume that you will invest the same amount year after year. This is probably not super realistic in real life. For the most of us, the investment amount will probably be different each year.
- Dividend portfolio principal – we assume that we will not touch the dividend portfolio principal. This is to be in-line with the DGI concept.
- Real estate rental income / Other passive incomes : we assume that you’re not adding more real estate properties to boost your future rental income. We are simply using growth rate (this is more like inflation rate) to determine how much your rental income will grow in the future. This is extremely simplified. This assumption holds true for the other passive incomes section as well.
- Taxes – Ahhh taxes, the one thing we can’t avoid in life. The calculations in the spreadsheet assume that your passive incomes are not being taxed. Again an extremely simplified assumption.
Some thoughts on the early retirement financial independence spreadsheet calculations:
- Your monthly expenses plays a CRUCIAL role on when you can achieve early retirement / financial independence. The more you spend each month, the more passive income you will need. It’s a lot easier to cut expenses than generating passive income. If you’re surprised by your FI age result, you can speed up your FI journey by reducing your monthly expenses.
- Contributing additional capital year after year will allow you to take advantage of the power of compound interest. If you play around with the yearly growth rate for each income section, it’s pretty cool how quickly the dollar amount increases 10 years down the road.
- There are a lot of assumptions in the spreadsheet and the calculations may not be 100% realistic. However, the numbers do give you a good overview where you stand today. If the numbers do not reflect what you have in mind, you can quickly figure out which areas you need to work on.
- It’s always good to have multiple passive income streams. Diversification is always a good thing.
You can get the file here: Financial Independence Spreadsheet
Comparing the age that we’ll hit FI between this version of the early retirement financial independence spreadsheet and the original by J. Money, we found that our FI age was reduced by 2 years in this version of spreadsheet. This reduction in years may not seem significant to some, but it is significant to us. First, it tells us that the power of compound interest is very powerful when it comes to re-investing dividends. It also tells us that if we can increase our annual contributions now rather than later, we can reduce the FI age even further. Even with our conservative estimates and calculations, we are around 8 – 15 years away from achieving financial independence. This result is roughly in sync with our target. It’s always good to know that what we’re doing today will result in great rewards in the near future.
Having said all that, the calculations and assumptions are based on our current situation. Considering that we are planning to have another kid, the new addition to the family will probably increase our expenses and will probably prolong our quest to financial independence. But if we were to worry about these other factors that may change our quest to FI, we will be worrying every single minute of our lives. While achieving early retirement / financial independence is important, it is also important to enjoy the small things in life as well as being at peace with yourself.
Please take a look at the spreadsheet, run some calculations, and let me know what you think. I would appreciate all the feedback.
Hey
I was wondering why one of the columns won’t plug in a number and just will show XXXXX. I’m new to excel spreadsheets so if you can advise?
Thanks for the sheet been looking for one similar to this for a while
Sorry which column are you talking about here?
you need to make the column slighty wider .. its not taking all of the numbers in so you will see XXX until you make it wider
Hi, I like the spreadsheet. I didn’t take the time to read all the comments or pore through your explanation of the sheet (I am pretty handy with spreadsheets myself), but I am wondering if I am misunderstanding the total passive income column. This column clearly adds the withdraw rate money from the non-dividend portfolio but then doesn’t seem to subtract that withdrawn money from the running total. The following year the total is multiplied by the chosen deposit amount and estimated growth rate without subtracting the withdrawn amount.
I think this accelerates the results falsely. Or am I completely out to lunch?
Good question. The spreadsheet simply calculates the age you’ll hit FI. It does not consider when you start making withdrawals.
I’ve come to the same conclusion. Great spreadsheet but the Total Passive Invoice each year is overstated slightly. The passive income on the non-dividend portfolio is not taking into account the fact that you are deducting 4% of the portfolio each year.
Therefore the calculation to calculate the age would be overstated as well.
I’d recommend updating a calculation to take into account the change in the non-dividend portfolio.
Awesome work with the spreadsheet, thanks for sharing it with us. It is nice to see other excel nerds tweaking and sharing – I love it.
Thanks Debtless in Texas for your kind words. 🙂
You beat me to it, Tawcan!
I’ve been working on a DGI ERE/FI spreadsheet myself over the past couple of days. I’m definitely going to check yours out and see if I can’t incorporate some good ideas in my own file.
Best wishes,
NMW
Let me know what kind of tweaks you end up with your spreadsheet. Always looking for inputs.
Great calculator. One thing I’ve noticed that is a variable I’ve tried to account for when performing a similar exercise is that my savings rate increases every year as my expenses stay about the same and my income goes up. Therefore my contributions into my after-tax accounts would increase every year. Maybe I’ll try to tweak your spreadsheet for this. Thanks!
Excellent spreadsheet Tawcan. It is going to be fun project of mine to play it with a bit more!
BSR
Awesome tool man. Will tweet to all my followers. Keep up the good work!
Thanks Asset Grinder, keep grinding hard!
Very cool and fun to play with, Tawcan. Thank you for sharing this awesome tool!
No problem Ryan, Hopefully the spreadsheet is useful for you.
Hi Tawcan,
Excellent, I will look and plug our data in this spreadsheet and see if I come to same conclusion from the one I did some time ago. Your seems to be much more fancy and professional.
If everything goes well, I will make a post using this info.
Thanks again to both of you and best regards,
RA50
Hi RA50,
Definitely keep me updated on whether you get to roughly the same conclusion.
Cheers.
I am a sucker for a great spread sheet! I play with J. Money’s before but I LOVE the tweaks that you made to this one. Minus the Canadian influence of course. I will be playing with this for hours!
Hi Rebecca,
Lol at the Canadian influence. I always get confused with the US equivalent of tax deferred/sheltered accounts, hence for adding a bit of Canadian touch. 🙂
Hi Tawcan
I had a go on J$’s original spreadsheet and it had me getting to FI in 12 years, so ahead of my own predictions.
I’ll have a play around on yours – thanks for working on it!
Hi weenie,
12 years is pretty damn good! Let me know if my version of spreadsheet changes that number.
Haha your spreadsheet is so detailed and well laid out – I don’t even have one. Maybe I’ll get around to creating one sometime, but since I’m young I figure I’d like to work towards $10 million and then I’ll retire. I’ve been working on a tech startup to help me reach my goal.
Hi Tony,
Thanks please play around with my spreadsheet and let me know if there’s anything missing. $10 million is a pretty big goal to aim for.
Like a lot of the other bloggers, I’ve got my own version of an early retirement estimator spreadsheet that I use. But all the same – I’ll have to check this one out. Nice work adding some mods of your own!
Hi MyMoneyDesign,
We have our own version of FI spreadsheet as well but this version is slightly improved than our original version. Let me know if there are anything that needs to be improved.
This is awesome Tawcan!
I love seeing my original spreadsheet tweaked and updated like this!
Going now to add it to my main page too so my readers can check it out and download as well.
Rock on bro.
Hi J. Money,
Thanks for updating your original post to include me.
I’ve been meaning to play around with that spreadsheet after reading J Money’s post. I did a very rough estimate and I think that we could get there in 10-15 years as well. Probably leaning towards earlier if we live NYC though! Tough decision though. Another thing is that if I stick it out for 15 years, part of me will want to stick it out for an additional 5 years to get my full pension (big penalty for leaving early).
Hi Andrew,
10-15 years time frame is pretty awesome. Pension will be a good thing to have but if you’re not happy with your job I wouldn’t stick around for another 5 years. I guess you’ll have to evaluate when the time comes.
Would you stick around if the difference in pension benefits is around $25,000 a year? The greedy side of me would consider it. Don’t hate the job, though I don’t really enjoy all that much either plus the commute kind of sucks. It’s something I’ll have to evaluate when I get closer!
Hi Andrew,
That’s a tough one. $25k a year is significant but you also need to consider whether the extra time is worth it to you and your family. Is there a way to fund that $25k from another source other than your pension benefits? Sounds like you’re not really enjoying your job and the commuting, how would that affect your overall health if you have to stick around for extra 5 years?
I love these financial independence things but as an index investor I wonder how it would apply to me. Do I just look at the dividends being paid out, some which happen just quarterly? Maybe I just need more income streams.
Hi Barry,
I suppose one would need to alter the spreadsheet a little bit to consider how much the “non-dividend” portfolio would yield when it comes to dividend. I guess for index investors you can either live off the dividends or withdraw the fund, or a combination of both.
Achieving financial independence in 15 years sounds great Tawcan. You sure have a great income stream building up and Im sure you guys will get there sooner rather than later. Thanks for sharing the spreadsheet – and a special thanks to J. Money. I will play around with the sheet.
cheers
R2R
Hi R2R,
Let me know if you find anything that can be updated. Always looking way to improve the spreadsheet.
So, what would be interesting [….] for those who invest dividends in taxable accounts. Which is better, taking a tax hit year after year, or “growth” investing? I know that is a bit of a hyperbole, but I don’t get the dividend obsession with dividends.
Hi Elroy,
Good point on alternative calculations. It might be tough to determine since tax rate will be different depending on the individual. I wouldn’t call it a dividend obsession but just a different concept when it comes to investing.
Our FI situation is tricky because we have rental income to work in there too. I believe we’ll be financially independent at 46, but I honestly don’t know. I think it’s fun to speculate, but I am not too concerned about the exact date now.
Hi Holly,
FI at 46 is pretty awesome. It’s fun to speculate and have a rough idea but you won’t know the “exact” date until your closer to the date.
Here’s my original template tweaked to include real estate and pensions that a fellow reader did 🙂
https://budgetsaresexy.com/files/er-re-pensions.xlsx
(It’s also uploaded to my main article as well fyi)
I love seeing everyone taking this and adapting to their own needs! So cool!!! We’re all such nerds! Haha…
I have my own spreadsheet but I love J’s templates as well! I think it’s great that you can combine a lot of different portfolios into 1 spreadsheet.
Hi The Money Spot,
The idea was to incorporate dividend investment into the calculation. Hopefully this version of the spreadsheet will be helpful to dividend investors.